
How to calculate p-value in Excel
 By
SpreadCheaters
By
SpreadCheaters
Excel has the right function for this. It is the T.Test function. The syntax of the function is written below:
=T.Test(array1,array2,tails,type)The arguments array1 and array2 are the data sets that you are going to test. The next argument which is tails is used to indicate whether it should be a one-tailed test or a two-tailed test. And lastly, the argument type is used to indicate the kind of T.Test to perform.
In doing a research paper, scientific conclusions should be supported by more than just the result of the statistical analysis itself. The soundness of the conclusions depends on the proper application of statistical methods with accurate interpretation of the statistical findings. The most commonly used statistical measurement is an index called Probability Value or “p-value.”
P-value is used to validate a hypothesis against the observed data. Its value ranges from 0 to 1. With just this value we can determine whether the obtained results should be taken seriously. In general, a p-value less than 0.005 is considered statistically significant which means we can reject the null hypothesis.
To use this function, we have here the data of 10 women who had taken dietary pills in a span of one week. Our null hypothesis would be: “The weight before taking the pills is not correlated to the weight after a week of taking the pills.”
Step 1 – Select data set
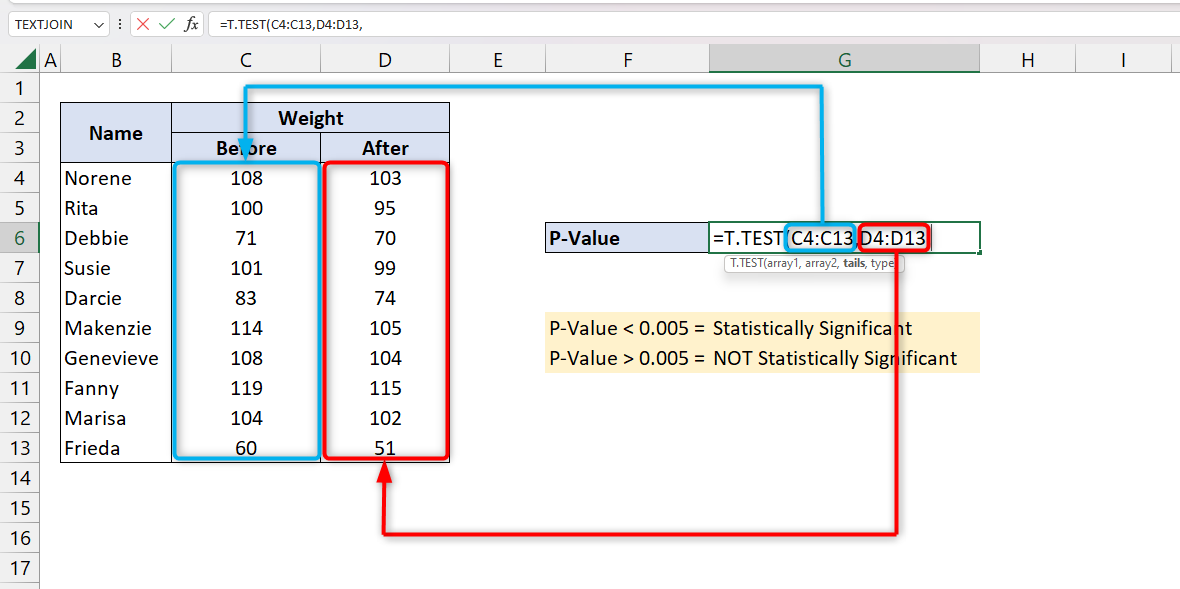
– Type “=T.Test’ then press TAB on your keyboard
– Select the data sets that you want to test. On our example, we will select cell ranges C4:C13 and D4:D13
=T.Test(C4:C13,D4:D13,
Step 2 – Select the tail and type of test you want to perform
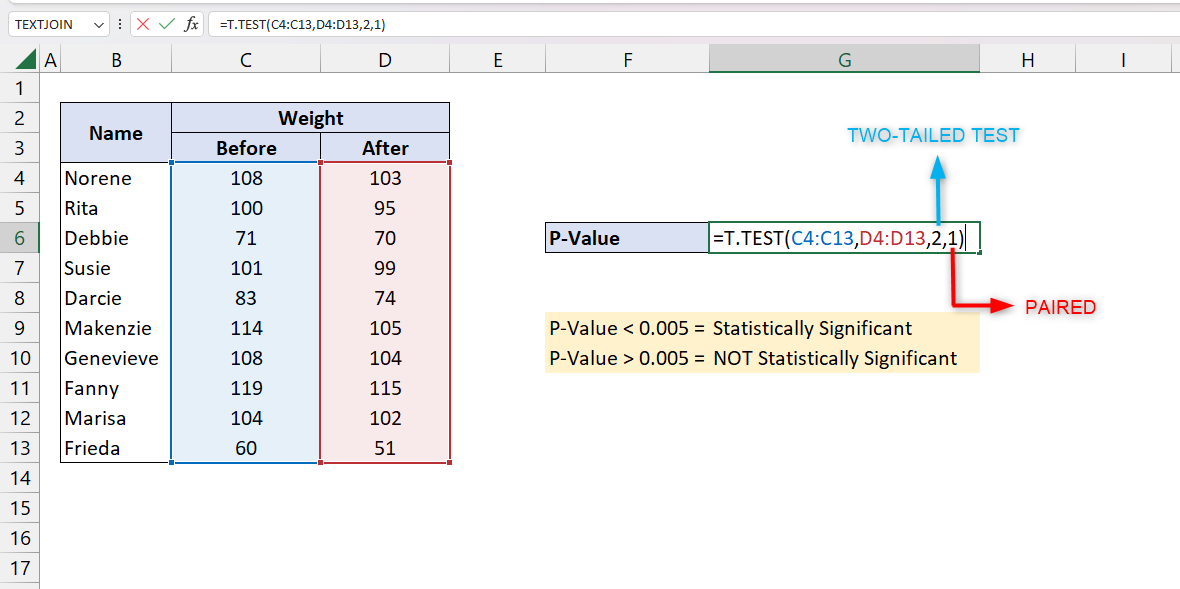
– To select one-tail test, insert “1” and to select two-tail test, insert “2”. We will be using a two-tail test in our example.
– There are three options in what type of T.Test to perform. To get the p-value, we need to select 1 or “Paired T.Test”
=T.Test(C4:C13,D4:D13,2,1)
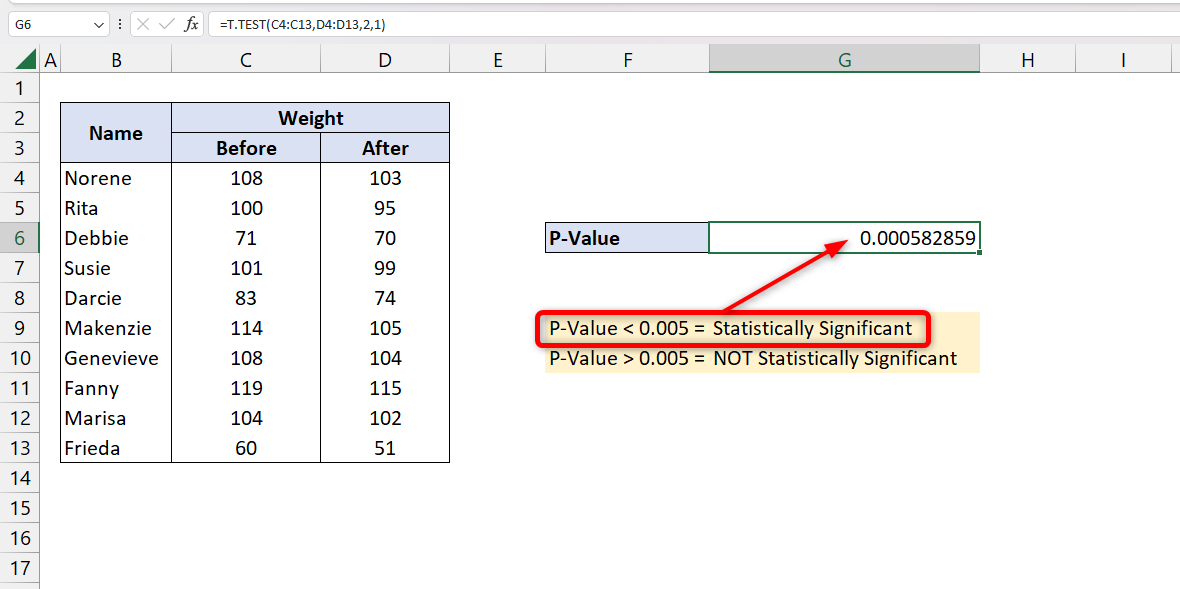
Step 3 – Enter and analyze the result

– After getting all the arguments, we can press ENTER on our keyboard. It will show the result of our p-value test.
– The result is less than 0.005 or 5%. It means that our two data sets correlate each other thus, the null hypothesis is false.


