
How to calculate beta in Excel
 By
SpreadCheaters
By
SpreadCheaters
You can watch a video tutorial here.
Beta is a very important metric for financial analysts. It measures the volatility of a stock (or a portfolio of stocks) when compared to the rest of the stock market. In Excel, you can calculate the Beta of a stock using either the Covariance and Variance functions or the Slope function. Here we use both methods.
Step 1 – Compute the percentage change in price
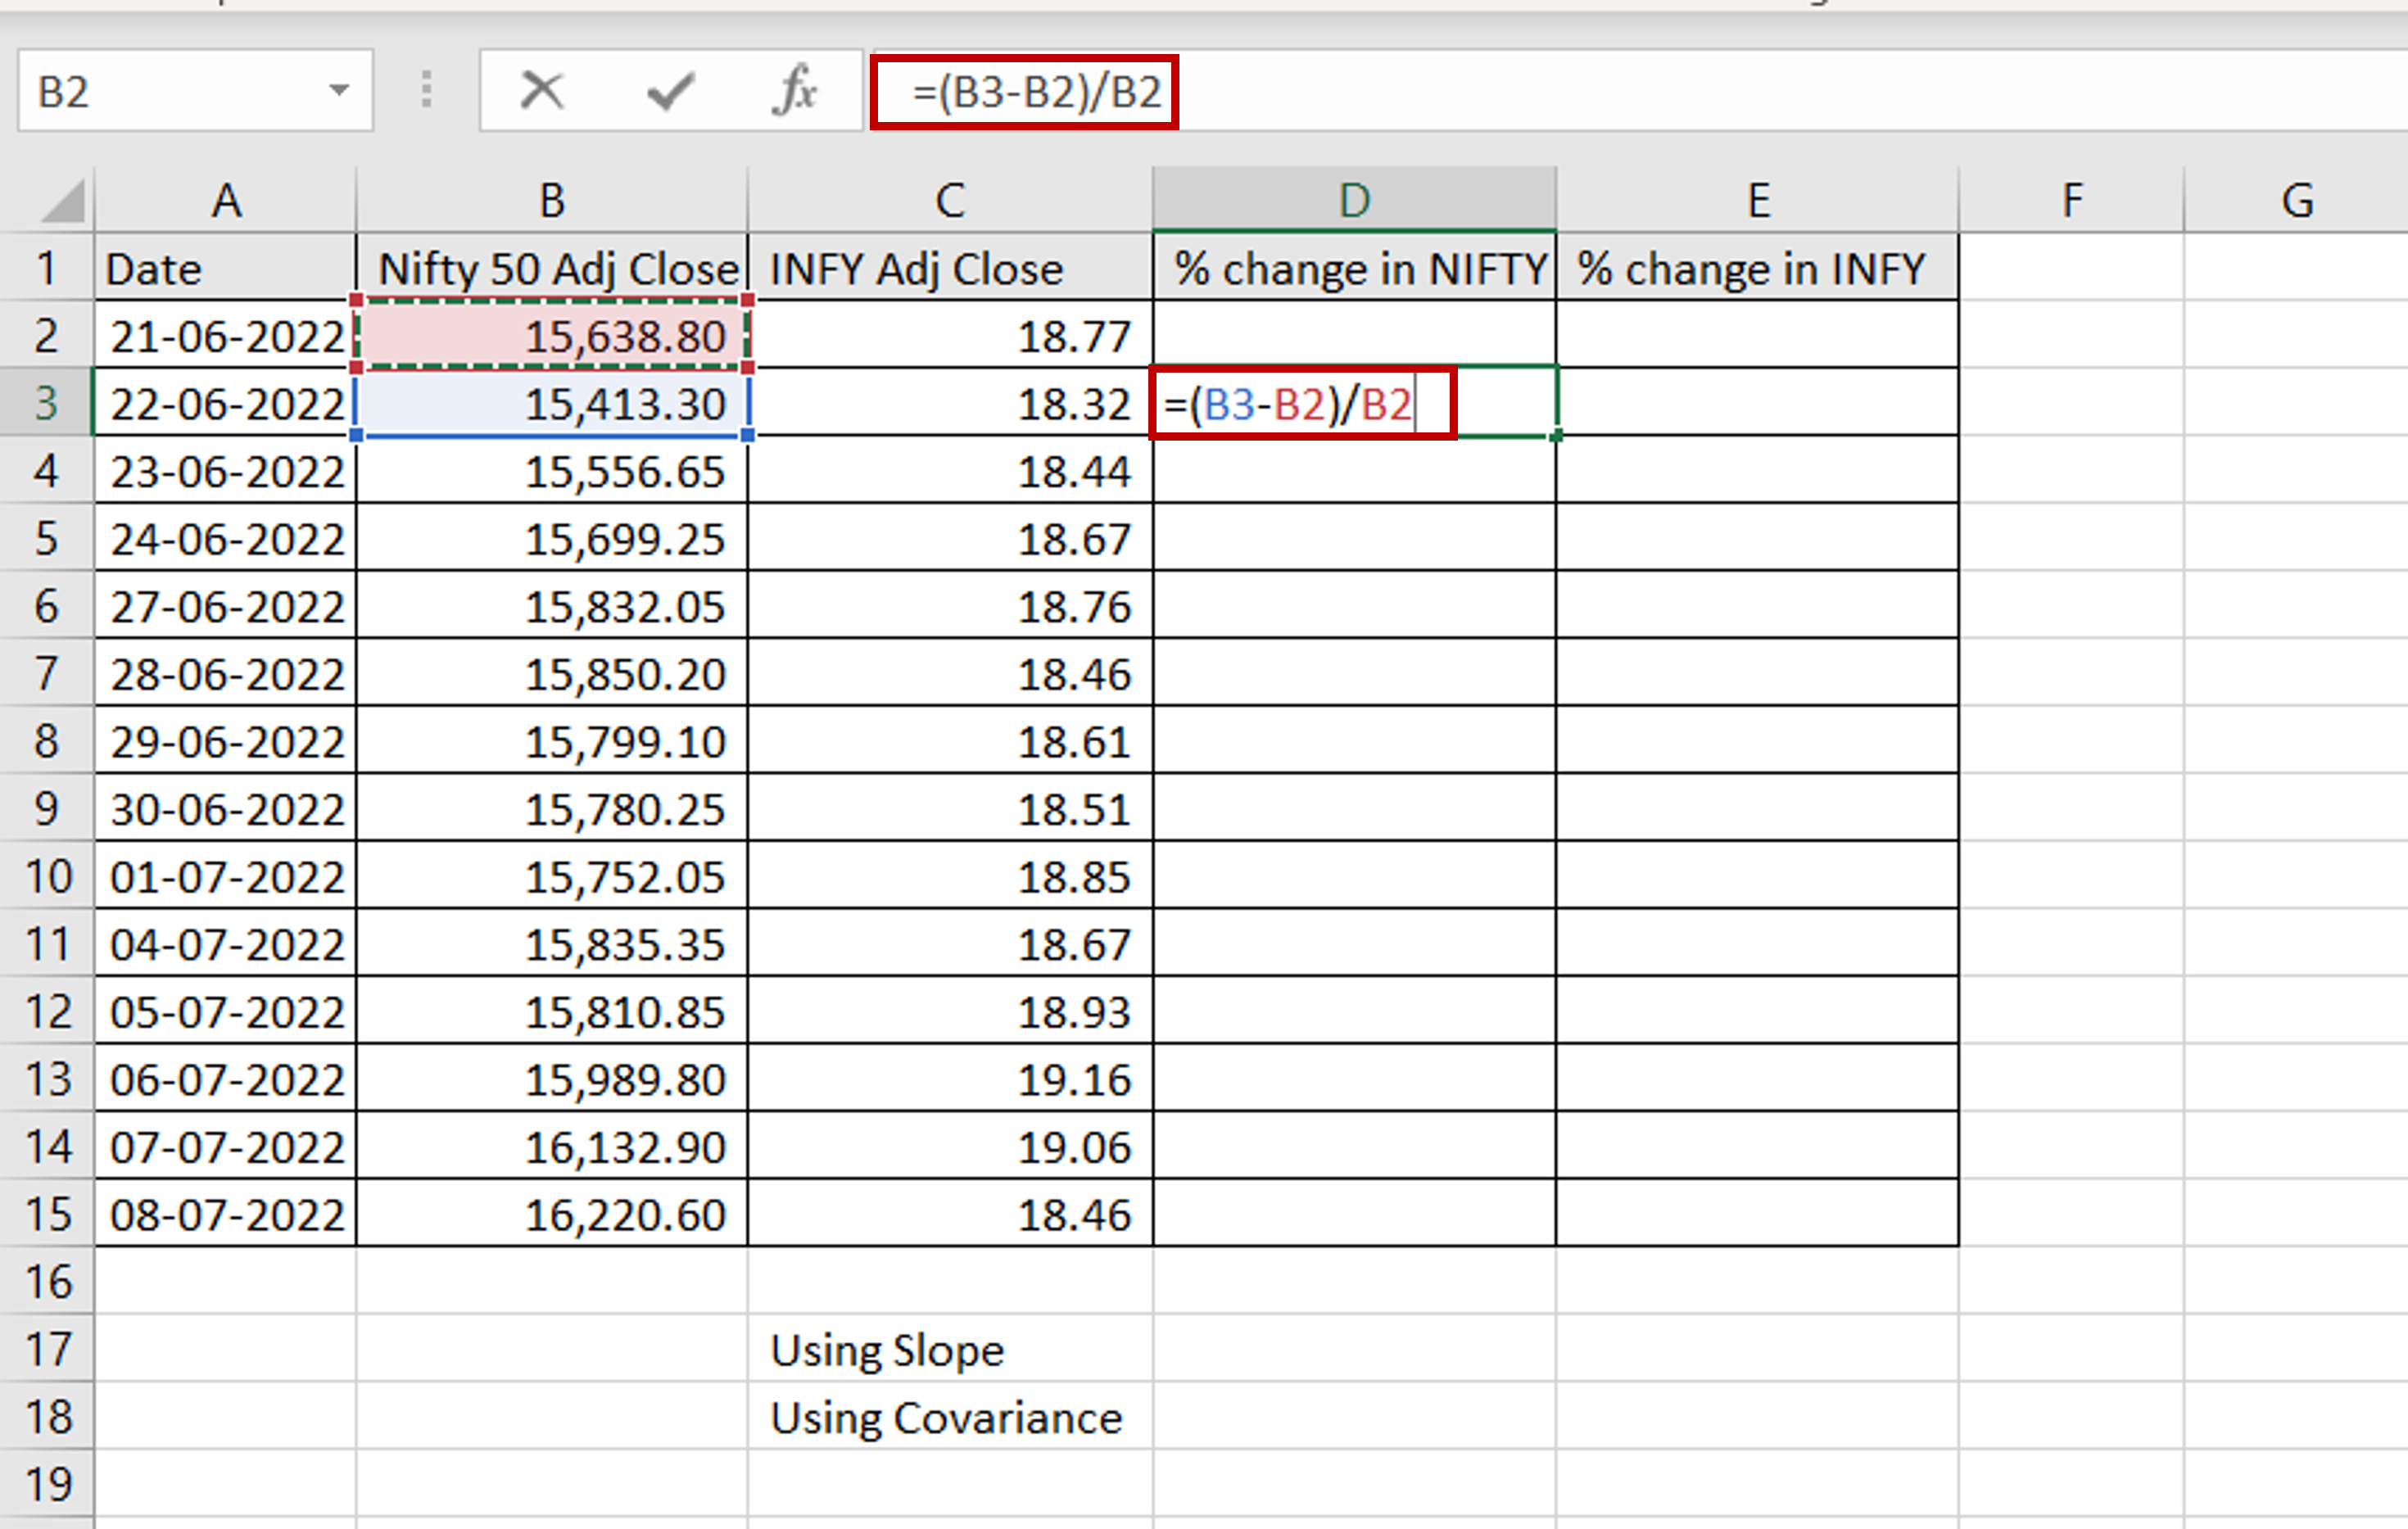
– In the second row of the ‘% change in NIFTY’ column, enter the formula for the change in price:
=(<cell reference of the ‘Nifty 50 Adj Close’ column> –
<cell reference of the previous ‘Nifty 50 Adj Close’ column>) /
<cell reference of the ‘Nifty 50 Adj Close’ column >
Step 2 – Copy the formula
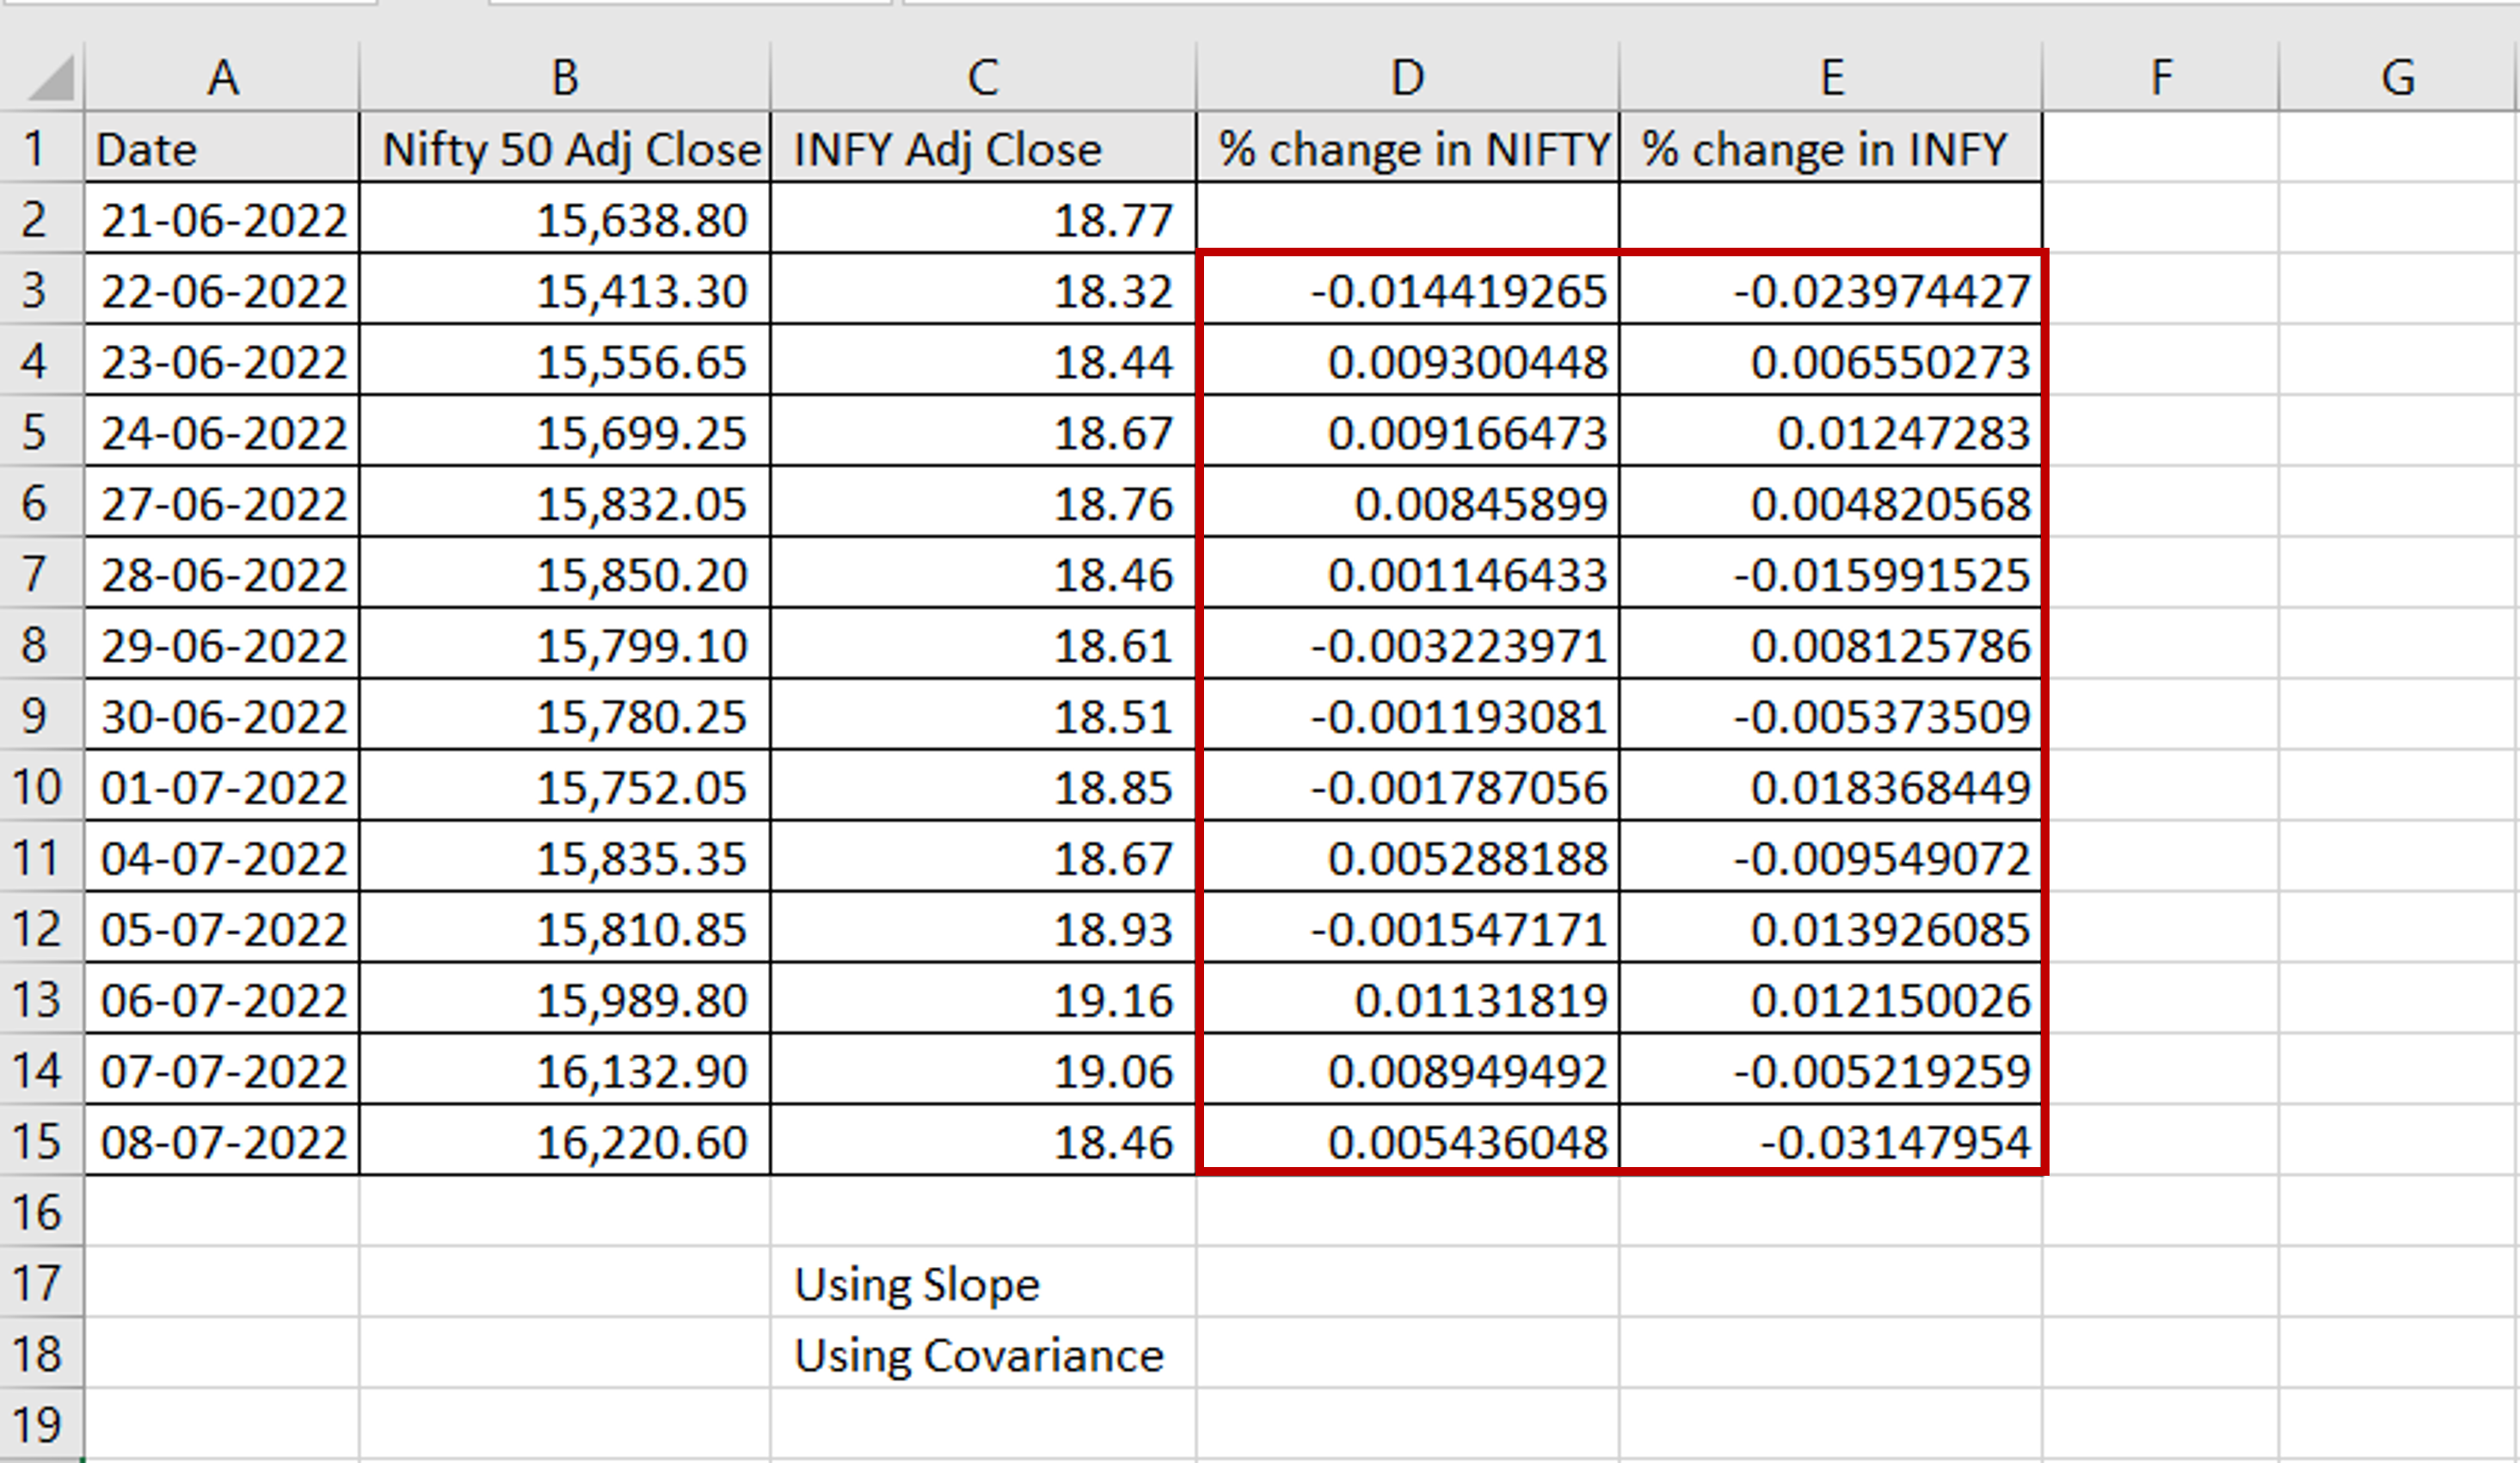
– Select the cell with the formula and press Ctrl+C or choose Copy from the context menu (right-click)
– Select the rest of the cells in the column and in the ‘% change in INFY’ column and press Ctrl+V or choose Paste from the context menu (right-click)
Step 3 – Use the SLOPE() function
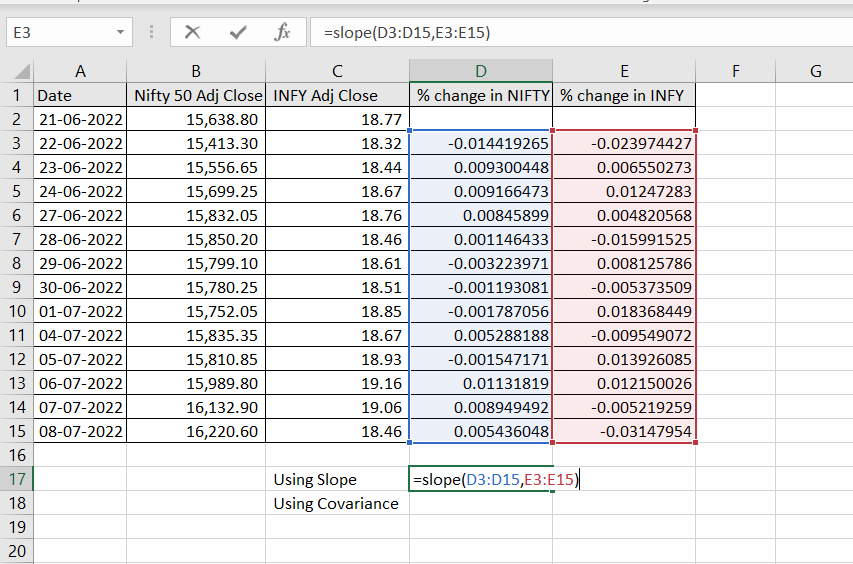
– Enter the formula for the slope:
=slope(<range of the ‘% change in NIFTY’ column>,
<range of the ‘% change in INFY’ column>)
Step 4 – Use the Covariance formula
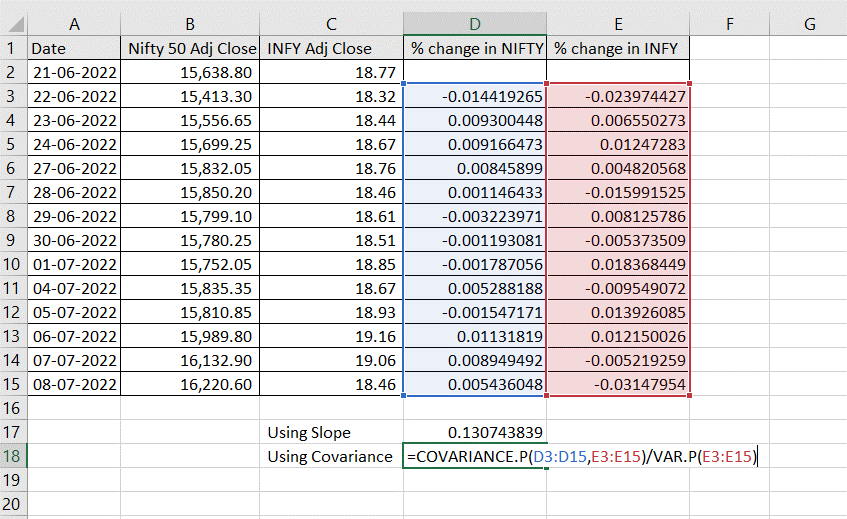
– Enter the formula for the covariance:
=covariance.p(<range of the ‘% change in NIFTY’ column>,
<range of the ‘% change in INFY’ column>)/
variance.p(<range of the ‘% change in INFY’ column>)
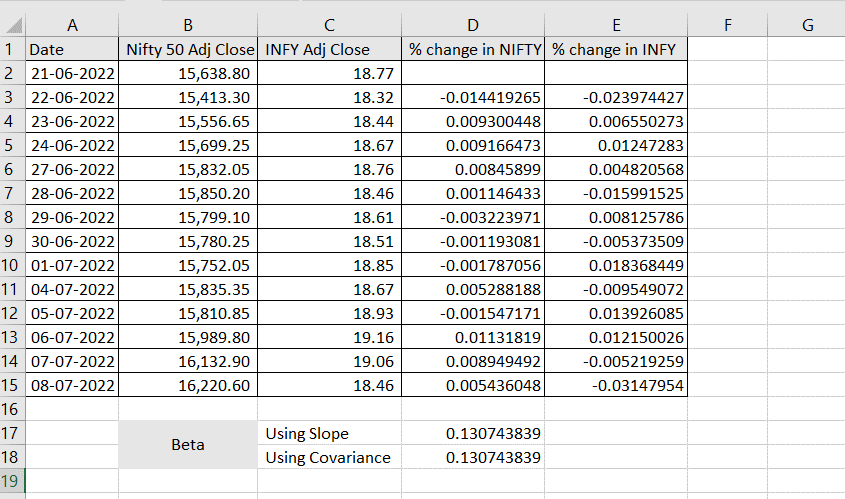
Step 5 – Check the result

– Both formulas give the same value which is the Beta for the INFY stock


