
How to calculate average of percentages in Microsoft Excel
 By
SpreadCheaters
By
SpreadCheaters
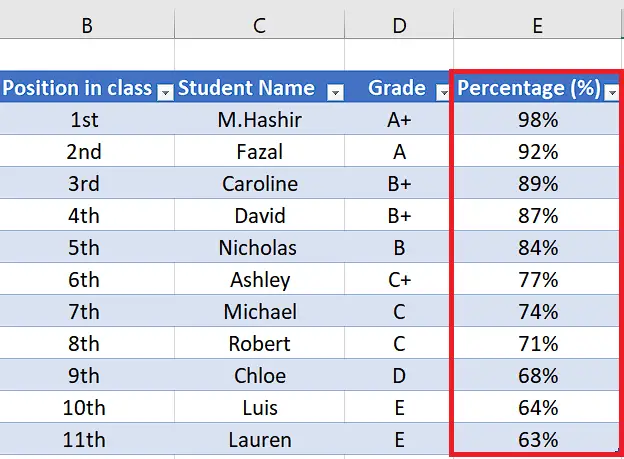
In today’s tutorial, we’ll learn how to calculate the average of the percentages of given data. Let’s begin by looking at the dataset below. It contains information about students regarding their grades, percentages and position in exams. We’ll learn the process of calculating average of the percentages by using the dataset above as an example.
As you can see the column named “Percentage (%)” is being highlighted by a red box, follow the steps below to find out the average of all values in percentage present in this column.

Microsoft Excel is a spreadsheet software program developed by Microsoft Corporation. It is a powerful tool for data organization and visualization. Excel allows users to create spreadsheets with data organized in rows and columns, and use various formulas and functions to perform calculations. Excel offers a wide range of functions for users and one of its features enables the user to calculate the average of percentages of any data.
Step 1 – Writing formula for ‘Average’ function
– Select any cell outside the dataset by pressing left click.
– Then press = button on your keyboard.
– Then type average and select the function from a small list that appears on screen.
Step 2 – Calculating Average of percentages
– Now, select the percentages of which you’re willing to calculate average by dragging your mouse while pressing left click.
– After selecting all values, add closing bracket i.e., ).
– Then press Enter.
– This will calculate the average of percentages as per our requirement.
Step 3 – Convert the format to percentage

– By default, Excel will show the average of percentages in number format. For better visualization, we’ll change the format to percentage.
– Select the cell in which you’ve calculated the percentage.
– Locate and press the percentage symbol (%) on the Home Tab in the number group.
– The average value will be converted to percentage.


