
How to calculate 95% confidence interval in Excel
 By
SpreadCheaters
By
SpreadCheaters
You can watch a video tutorial here.
The 95% confidence interval is used in statistics to define a range of values that you can be 95% confident of containing the mean of the population. Excel has a Data Analysis add-in that can help you calculate the 95% confidence interval.
Note: If the Data Analysis button is present under Data > Analyze, then skip steps 1 to 3
Step 1 – Open the Excel options window

– Go to File > Options
Step 2 – Manage the Add-ins
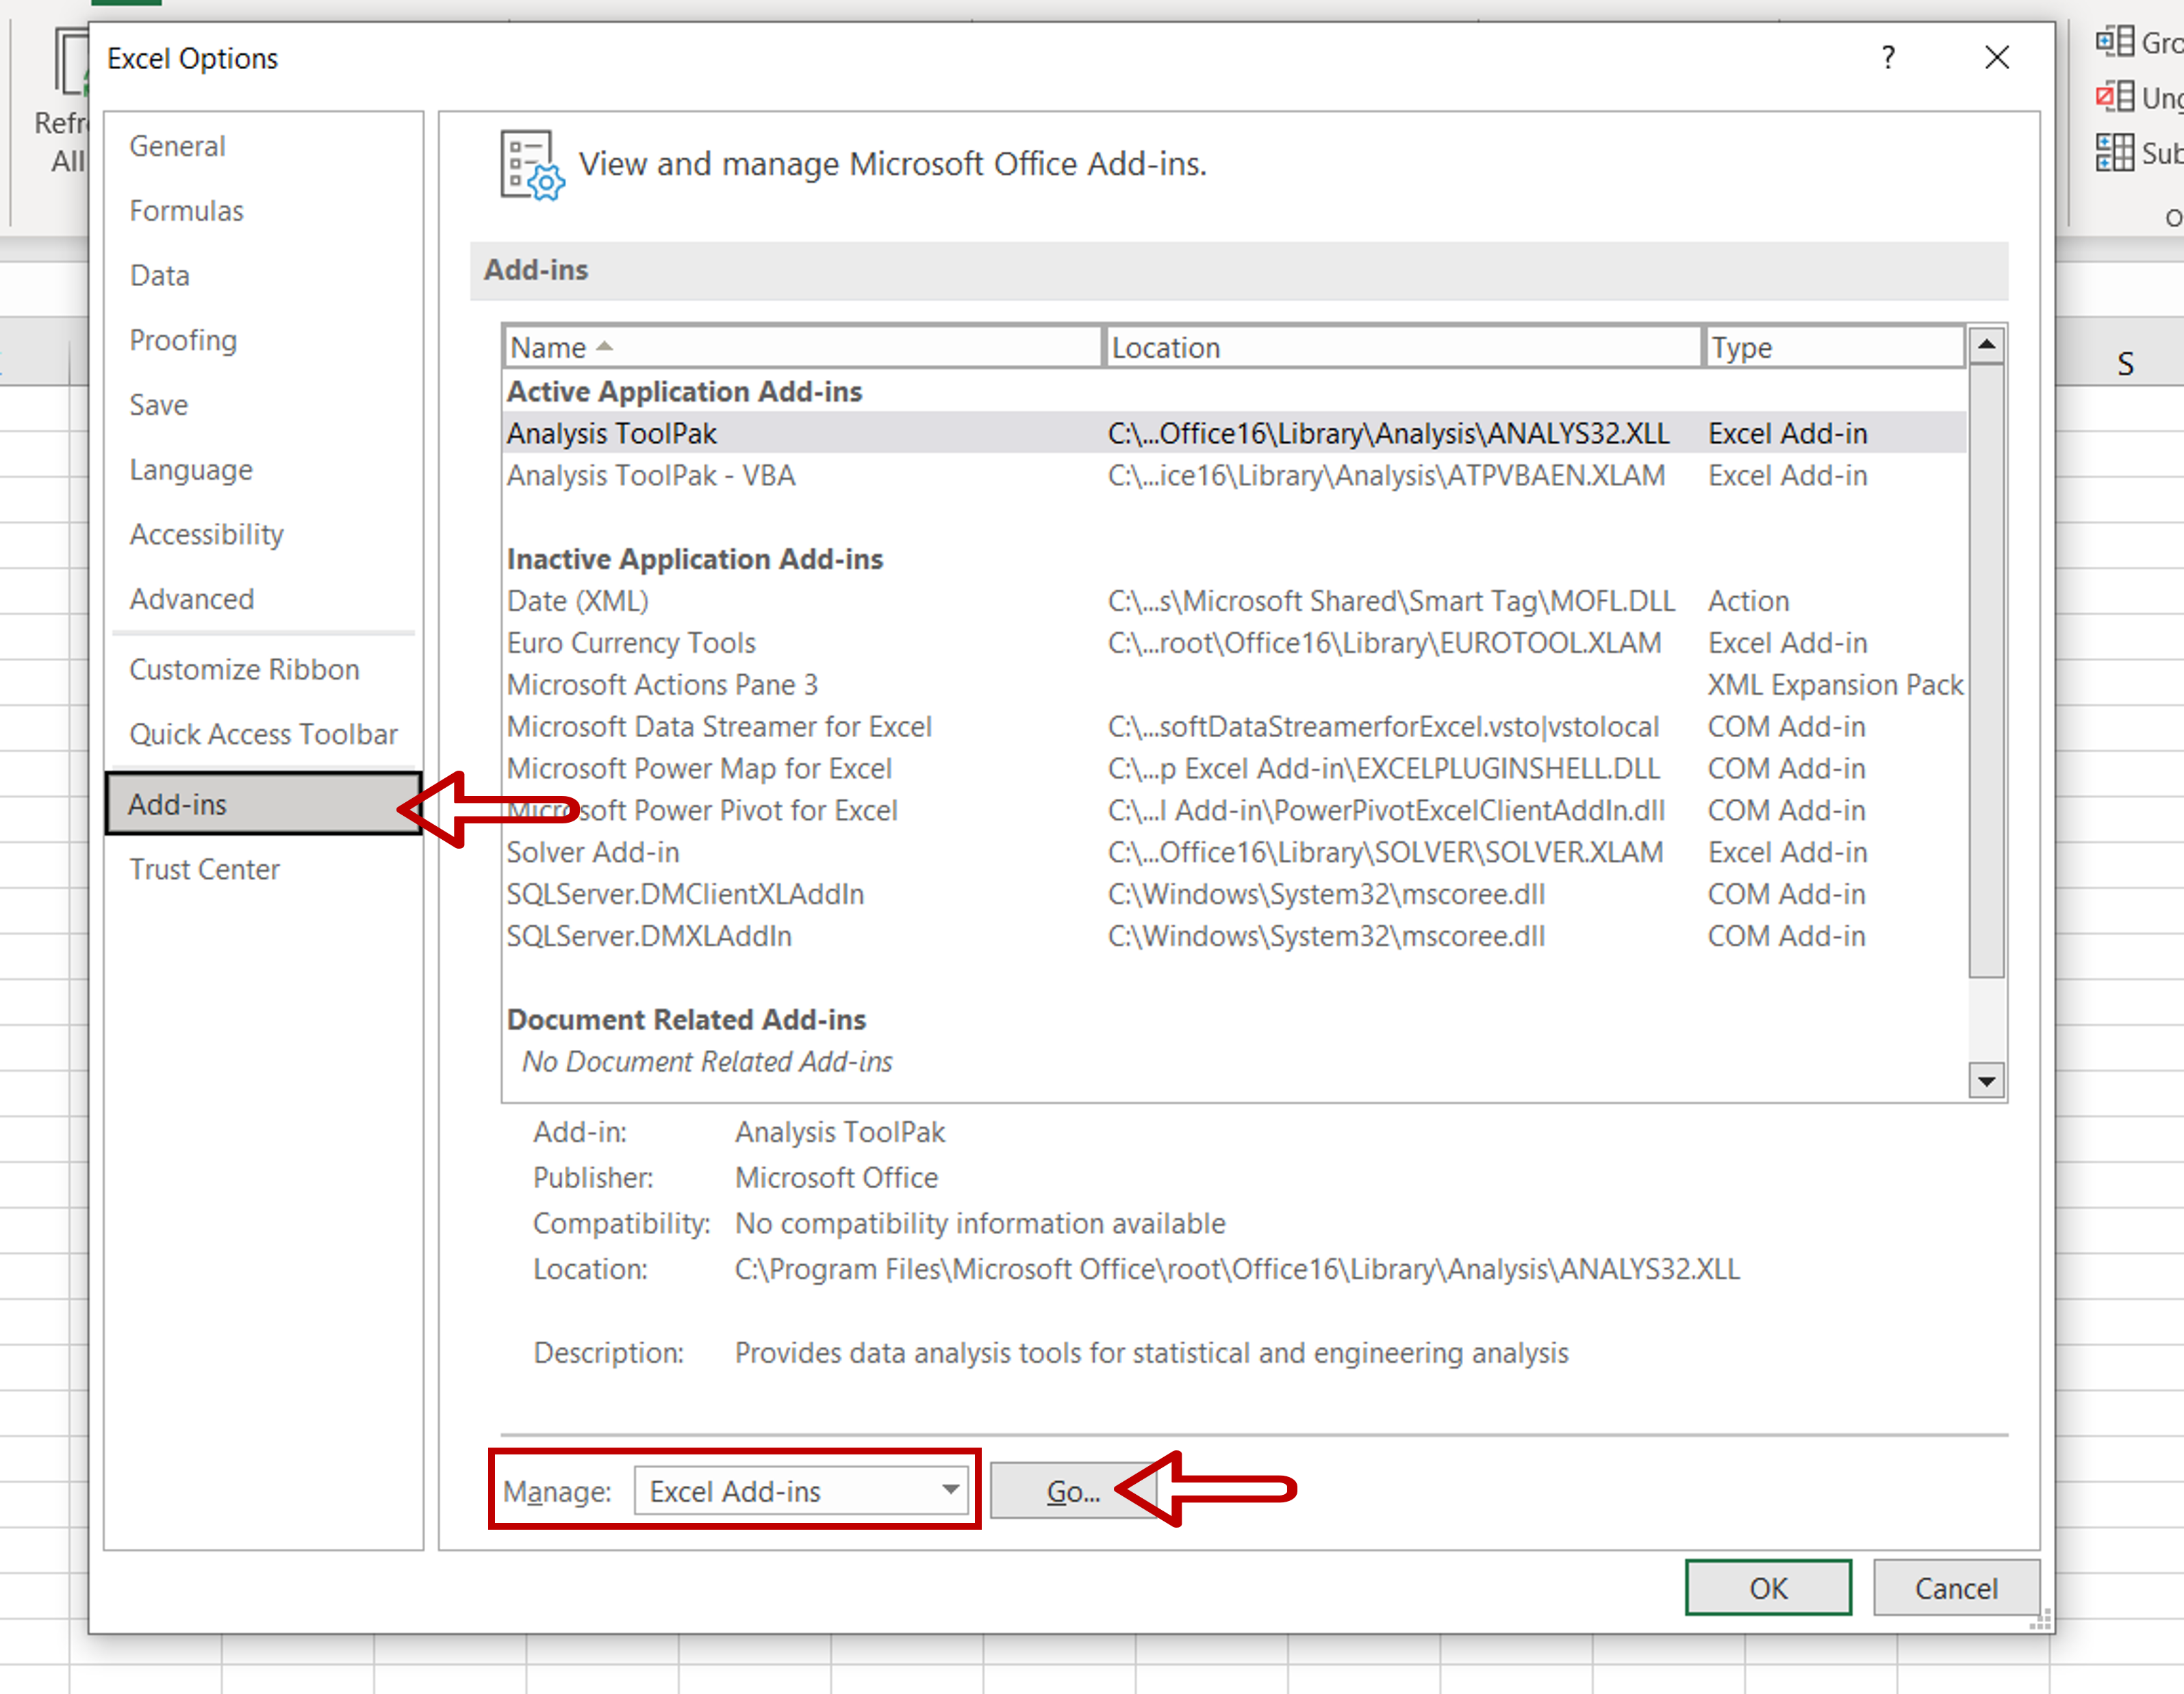
– Go to Add-ins
– Select Excel Add-ins from the Manage drop-down
– Click Go
Step 3 – Load the Analysis ToolPak add-in
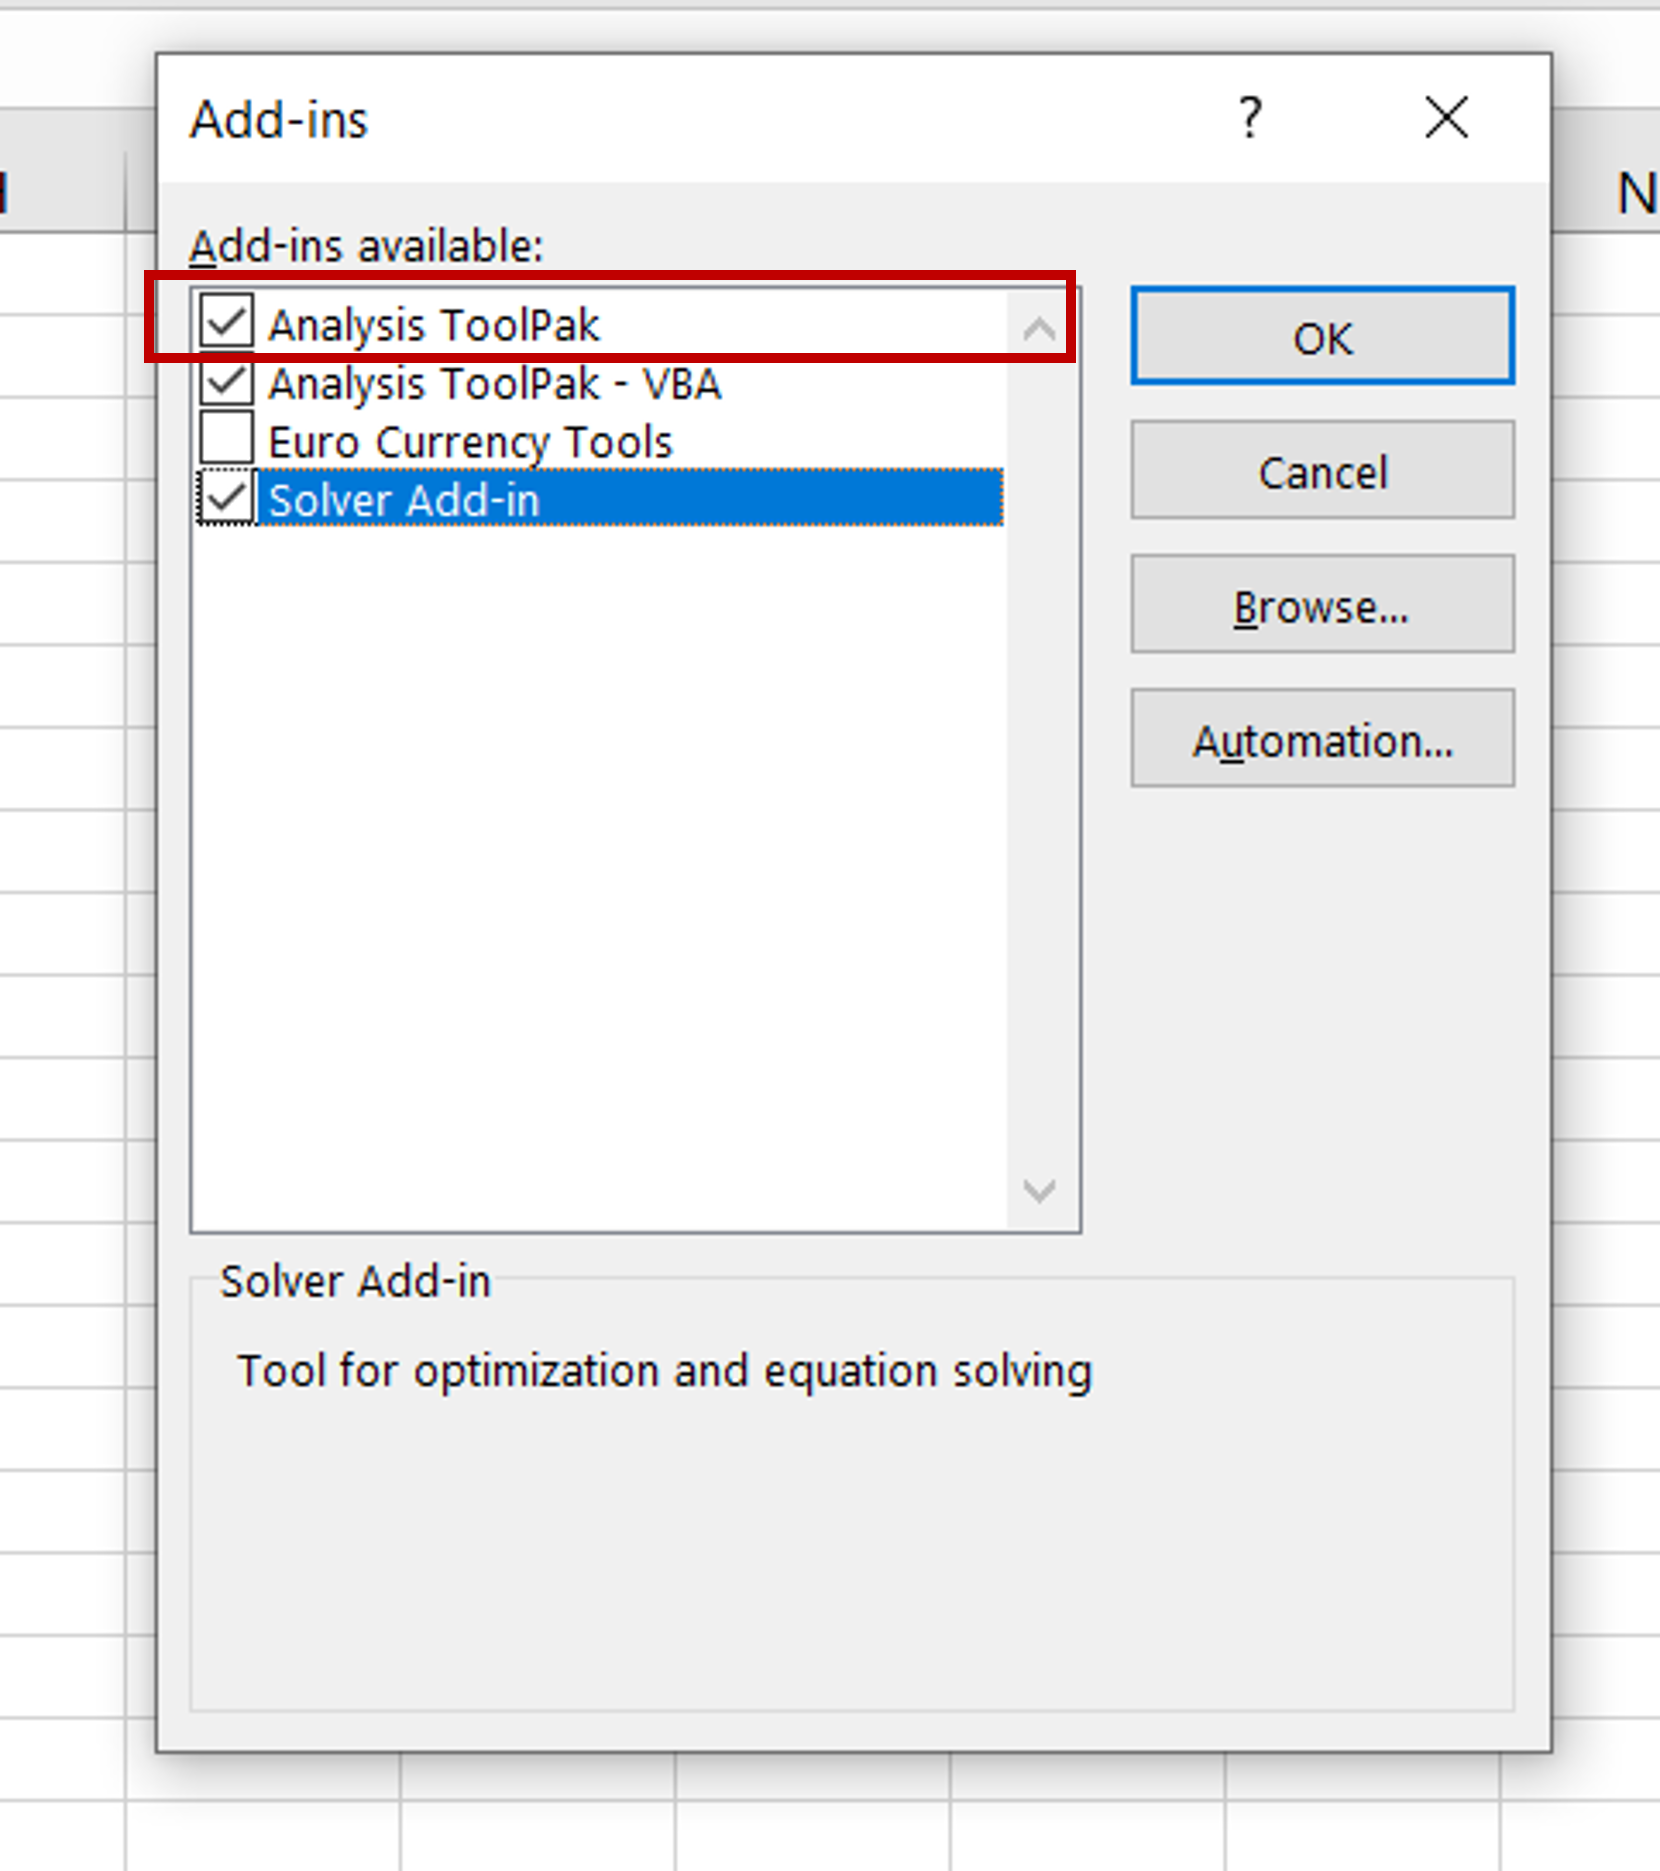
– Select Analysis ToolPak
– Click OK
Step 4 – Open the Data Analysis window
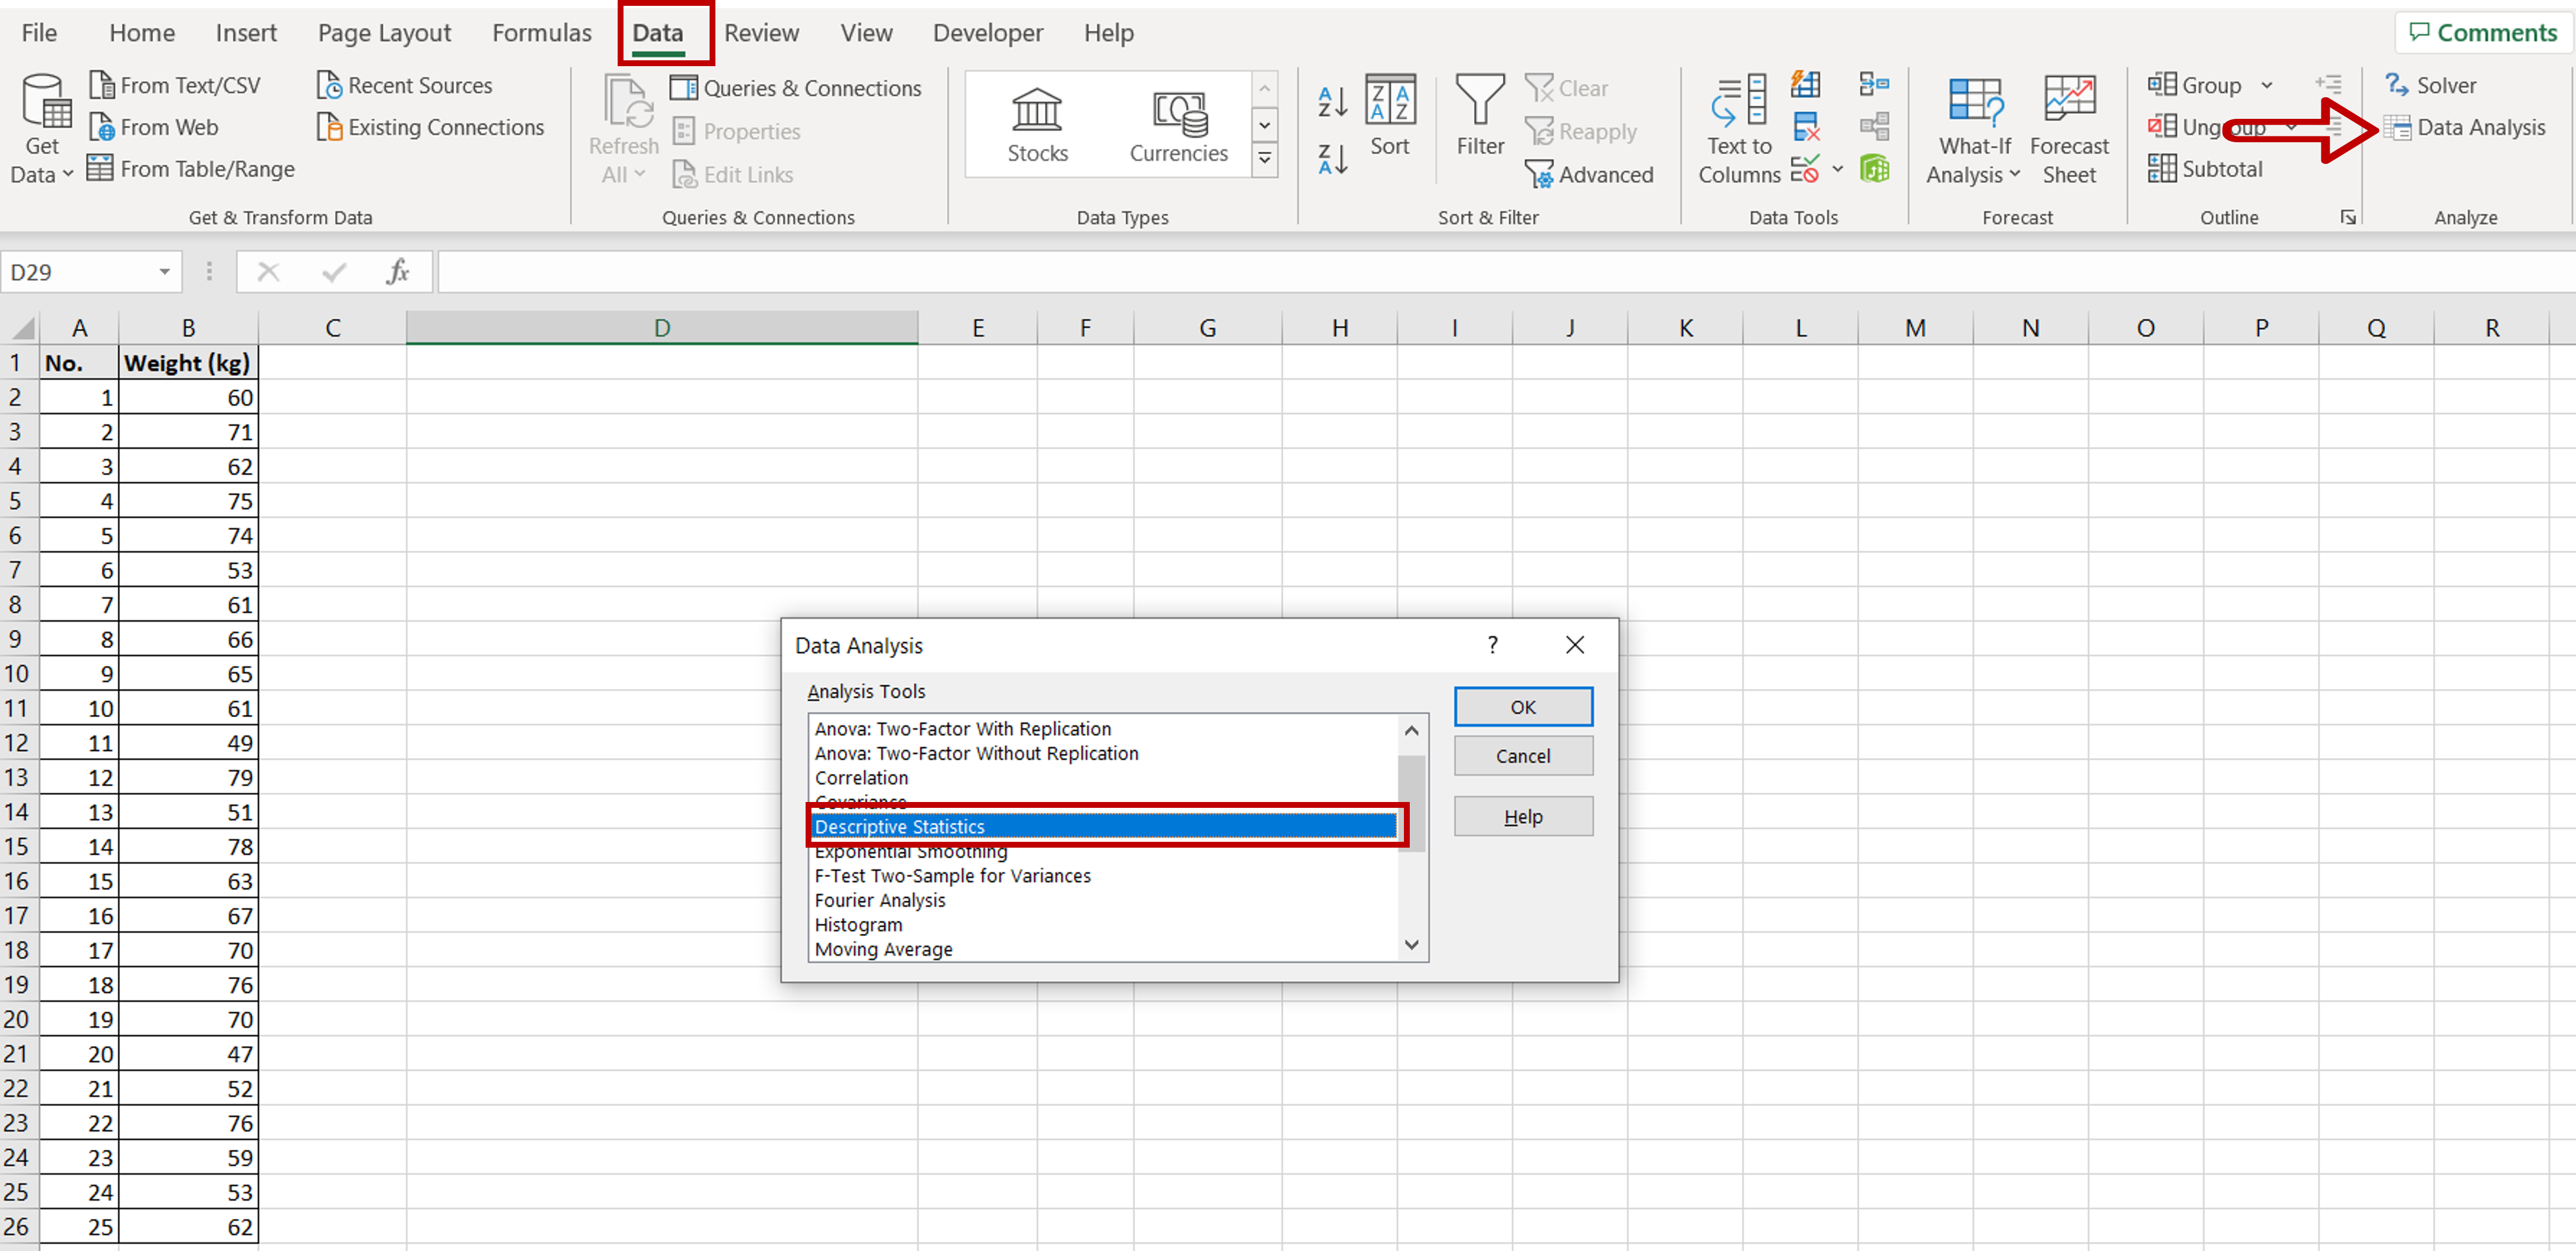
– Go to Data > Analyze
– Click on the Data Analysis button
– In the window, select Descriptive Statistics
– Click OK
Step 5 – Set the parameters
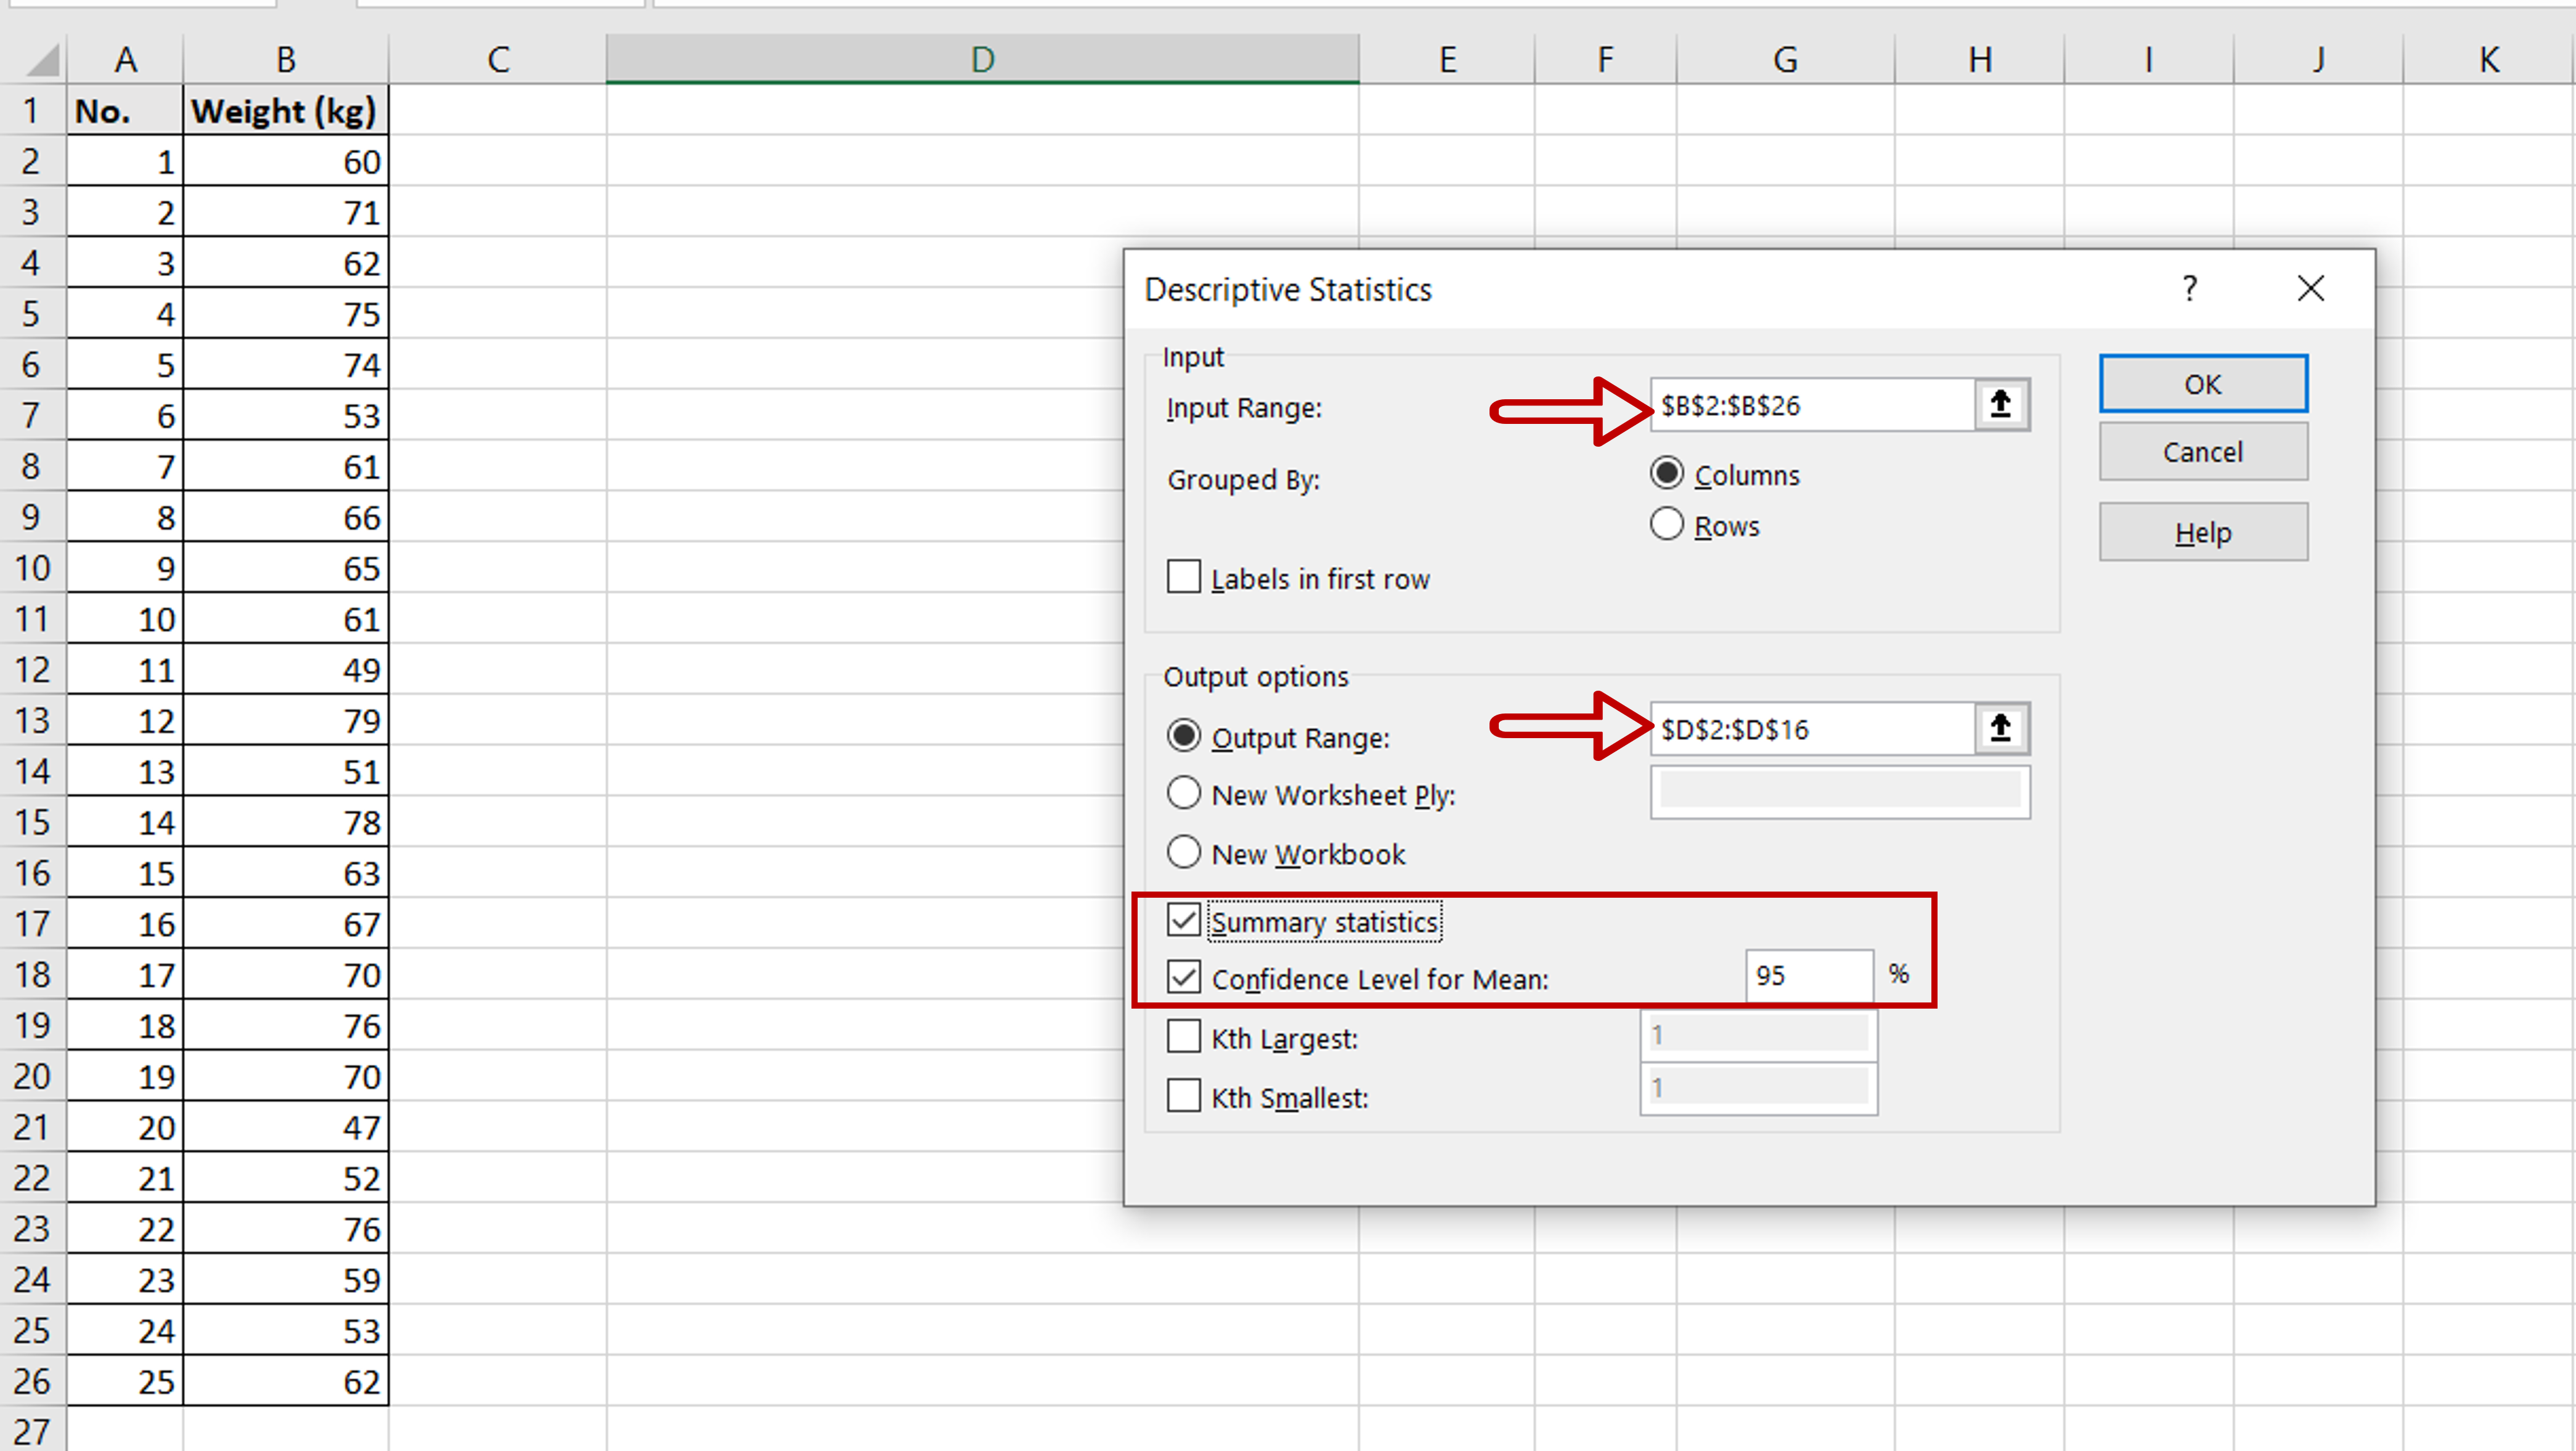
– Define the input and output ranges
– Tick the Summary statistics check-box
– Tick the Confidence Level for Mean check-box and set the percentage as 95
– Click OK
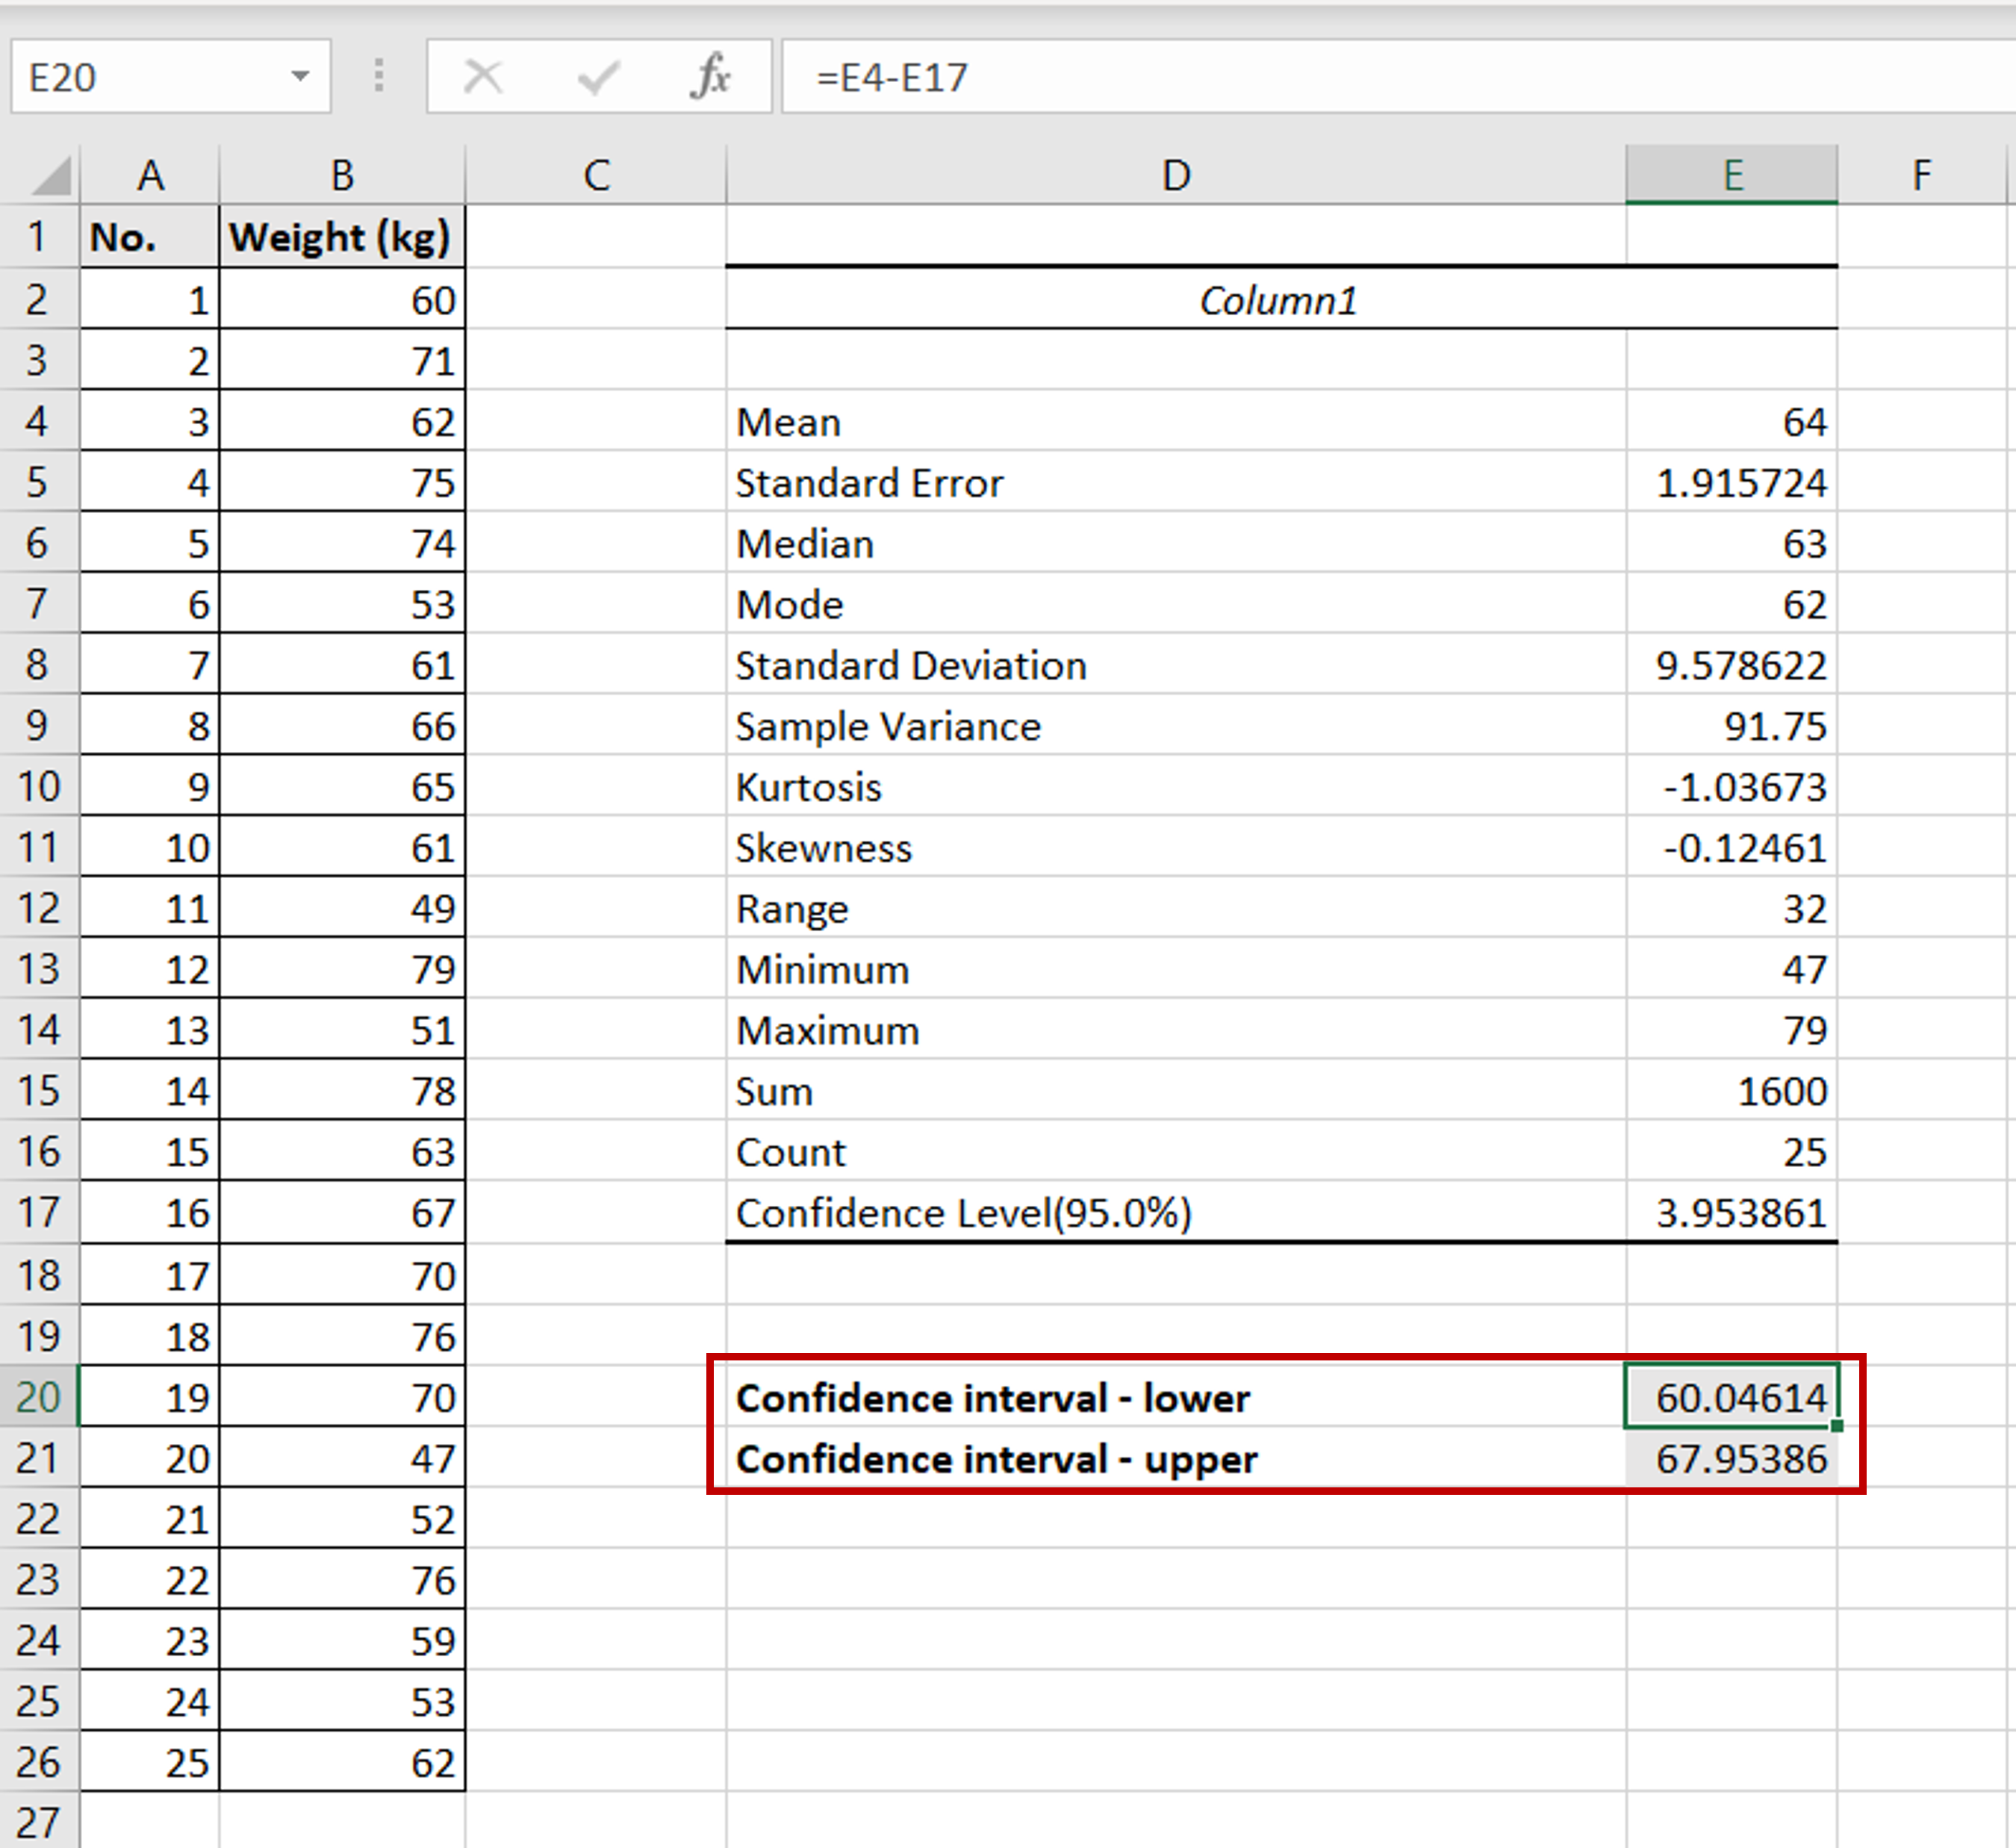
Step 6 – Compute the 95% confidence interval

– Enter the formula for the lower limit of the confidence interval:
=<cell reference of the ‘Mean’> – <cell reference of the ‘Confidence Level(95.0%)’>
– Enter the formula for the upper limit of the confidence interval:
=<cell reference of the ‘Mean’> + <cell reference of the ‘Confidence Level(95.0%)’>


