
How to add two things on the same X-axis in Microsoft Excel
 By
SpreadCheaters
By
SpreadCheaters
In this tutorial, we will learn how to add two things on the same X-axis in Microsoft Excel. In Microsoft Excel, to add multiple items on the same x-axis, navigate to the “Select Data Source” dialogue box and include new series in the “Legend Entries” section. This feature allows for the easy comparison of different data sets on a single graph. Moreover, it provides a visually appealing representation of complex data that would otherwise be difficult to analyze.
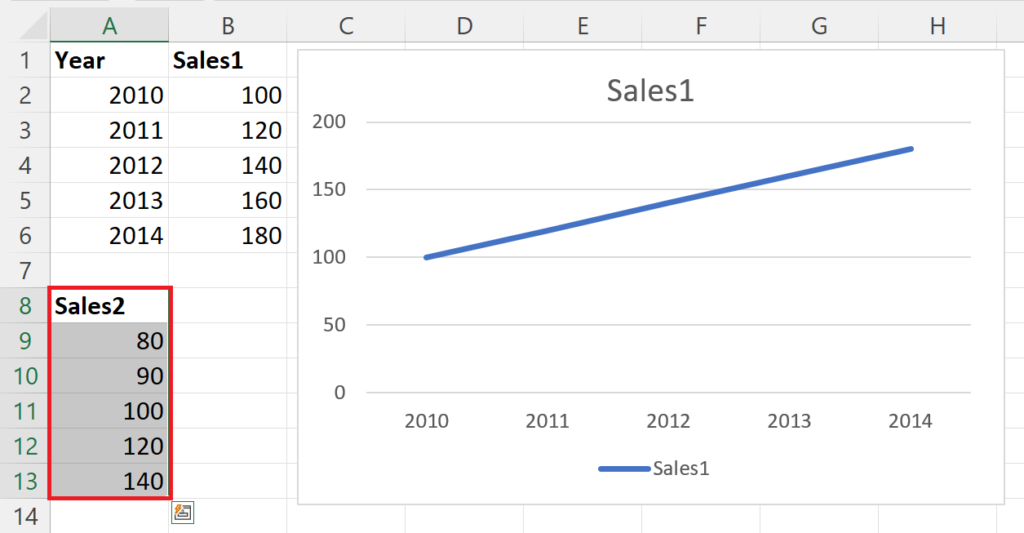
Currently, we have a graph representing the sales figure i.e. Sale1. We want to add another sales figure i.e. Sales2 on the same X-axis.
In Excel, adding two things on the x-axis usually refers to creating a chart that displays two sets of data on the same horizontal axis. Adding two things on the x-axis in Excel can be a powerful way to visualize and analyze data. By comparing different sets of data on the same chart, you can quickly spot patterns and trends that might not be apparent when looking at the data separately.
Step 1 – Right Click on the Graph
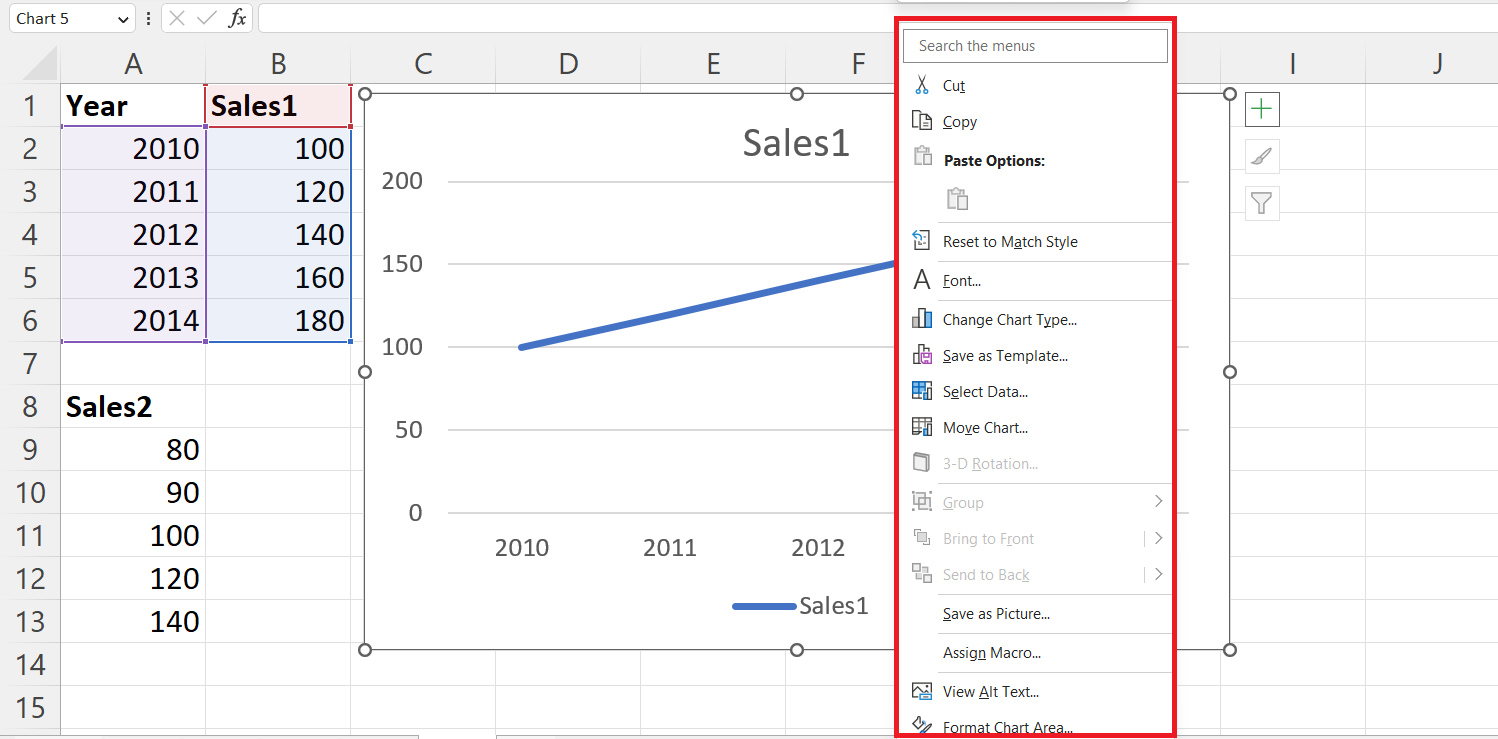
– Right click on the graph in which you want to add two things on the same X-axis.
– A context menu will appear.
Step 2 – Click on the Select Data
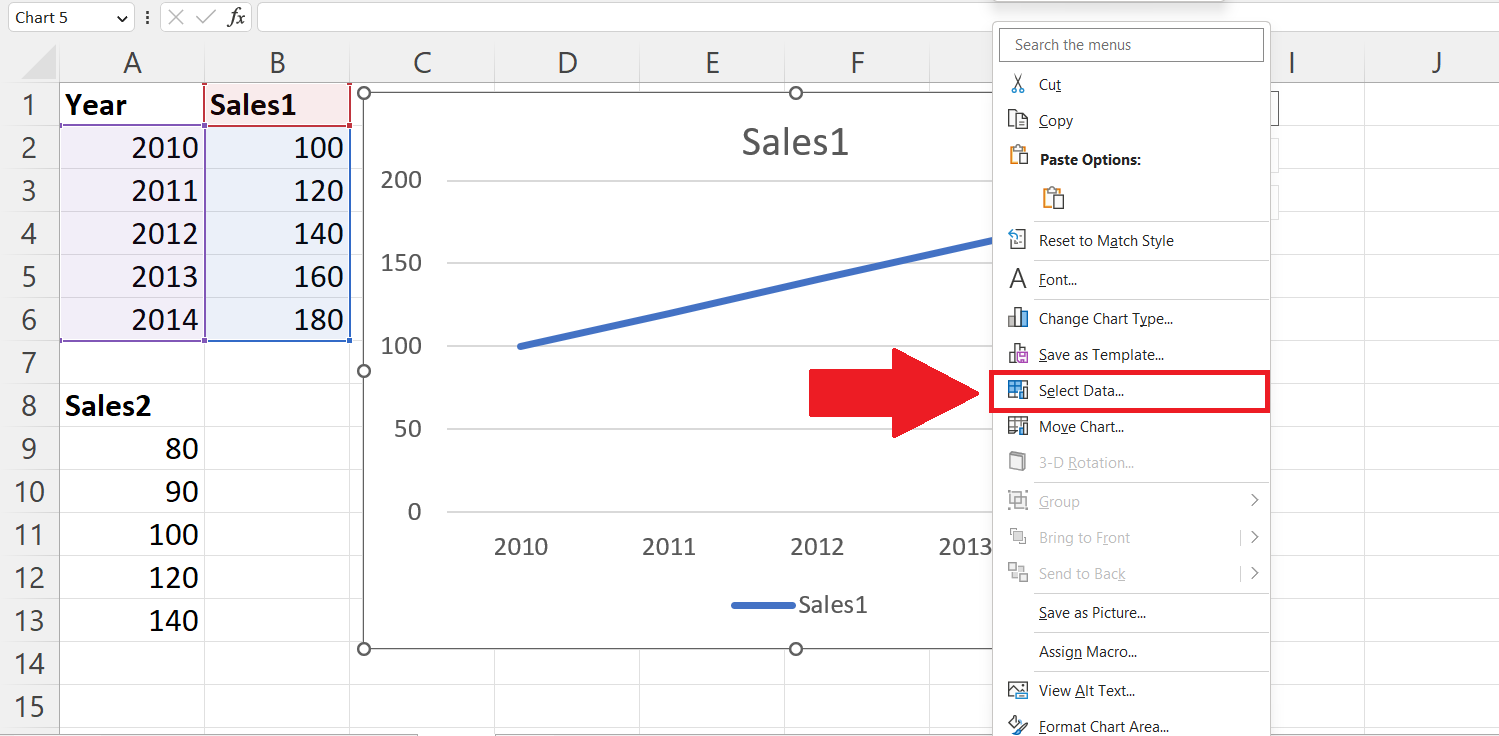
– Click on the Select Data option in the context menu.
Step 3 – Click on the Add Option
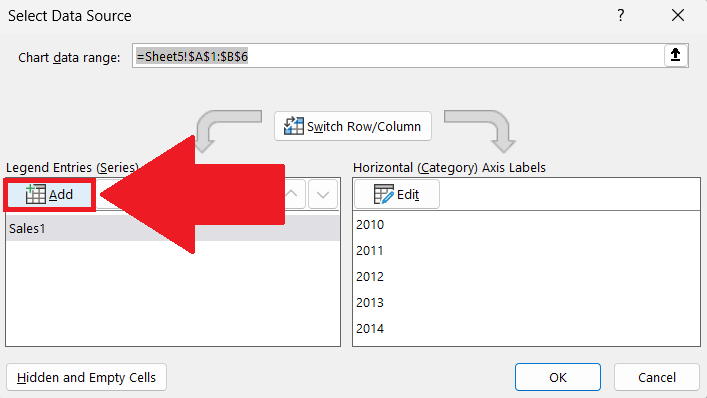
– Click on the Add option in the Legend Entries section.
– Edit Series dialogue box will appear.
Step 4 – Name the Series
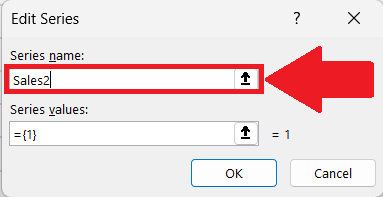
– Enter the name of the new series in the Edit Series dialogue box.
Step 5 – Select the Data Range and Click on OK
– Select the range containing the data for the new series.
– Click on OK in the Edit Series dialog box.
Step 6 – Click on OK

– Click on OK in the Select Data Source dialogue box.
– The new series will be added on the same X-axis.


