
How to add two sets of data in one graph in Excel
 By
SpreadCheaters
By
SpreadCheaters

Excel offers a very interesting way to add two sets of data in one graph. We can cater to this problem statement by using the select data option in the graph. We can perform the below mentioned way to add two sets of data in one graph excel:
We’ll learn about this methodology step by step.
To do this yourself, please follow the steps described below;
Step 1 – Excel workbook with a graph and 2 sets of data
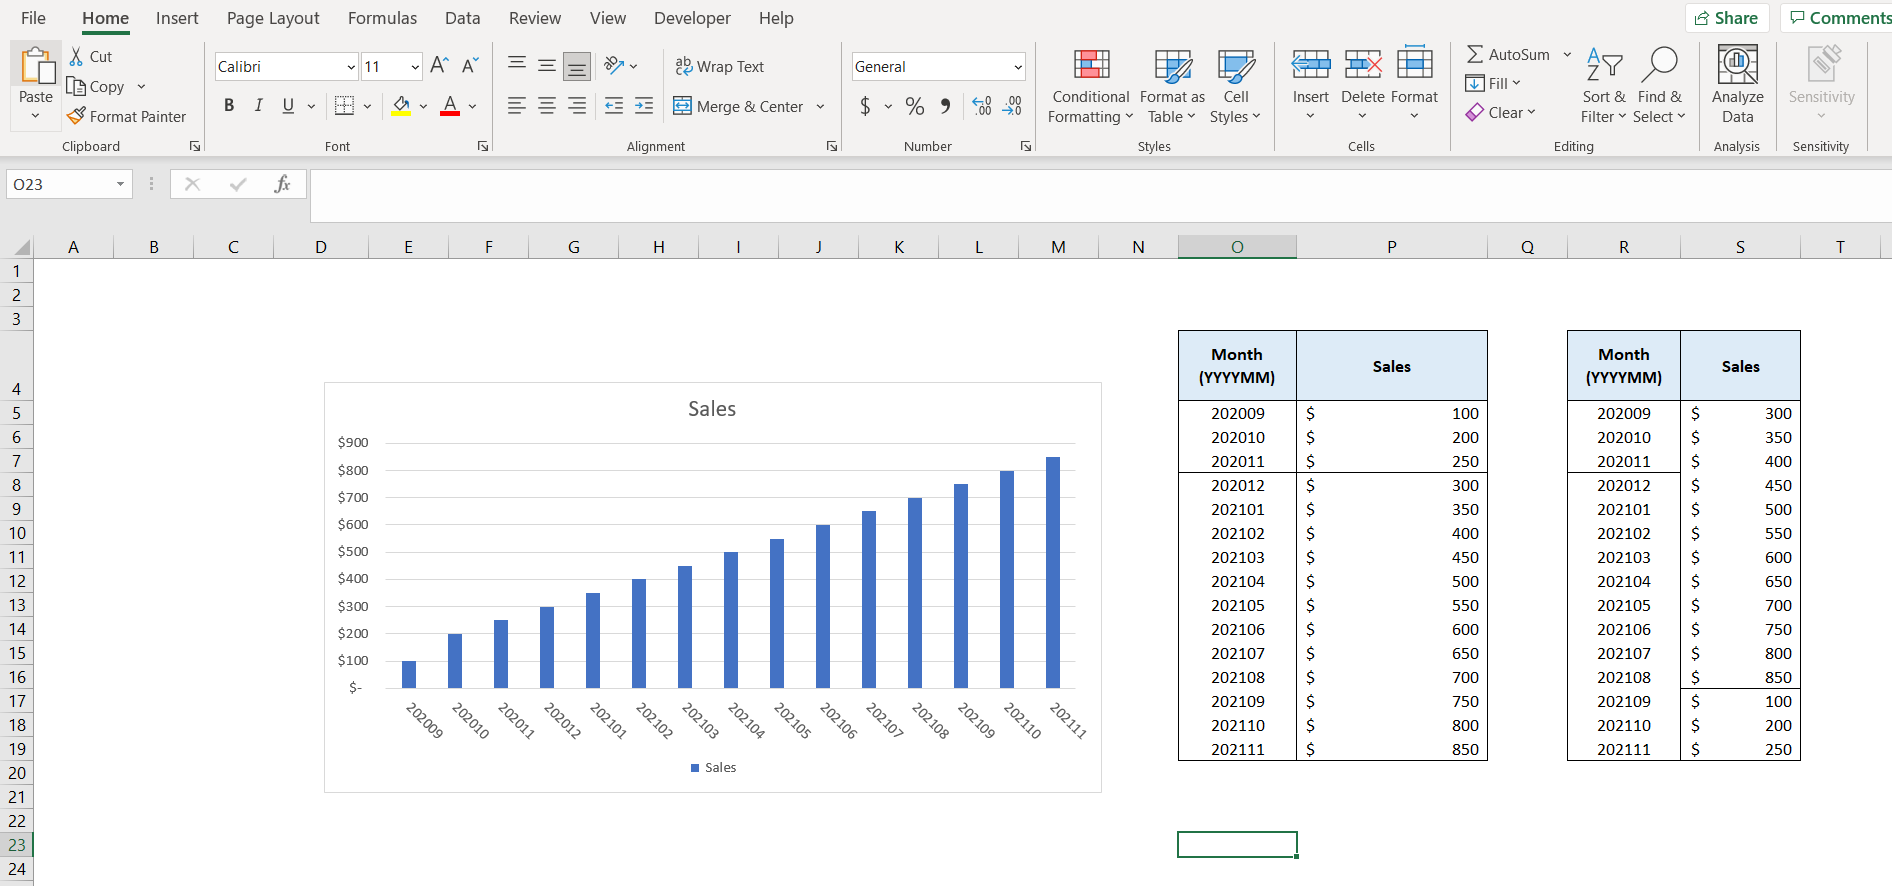
– Open the desired Excel workbook containing a graph and 2 sets of data. Out of the 2 sets of data, the graph is currently using the first set of data.
Step 2 – Select data option
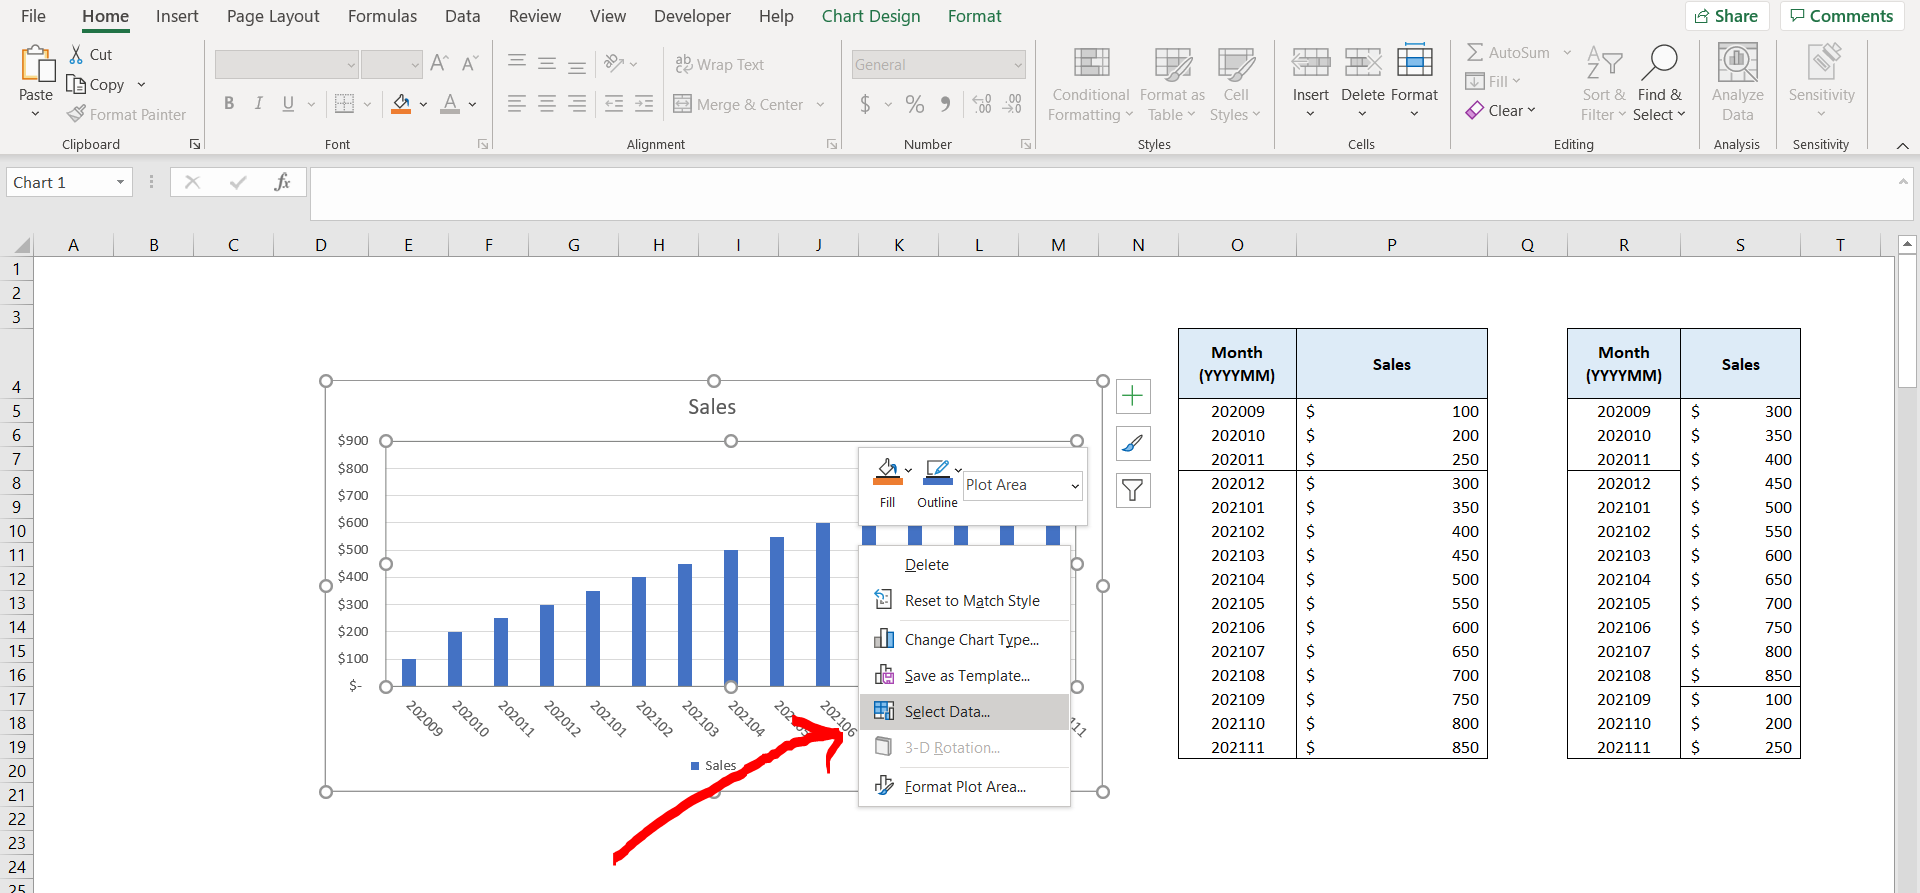
– Now click on the graph, and select the “Select Data” option.
Step 3 – Select data dialogue box
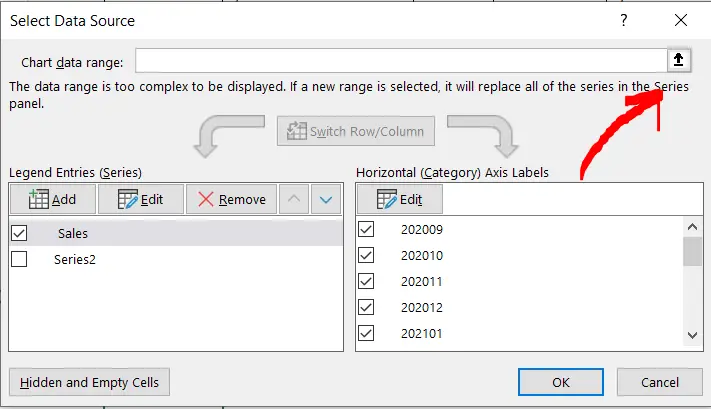
– A dialogue box would appear, click on the arrow shown by the red arrow to select the second set of data which you want to add to the graph.
Step 4 – Selecting all the data
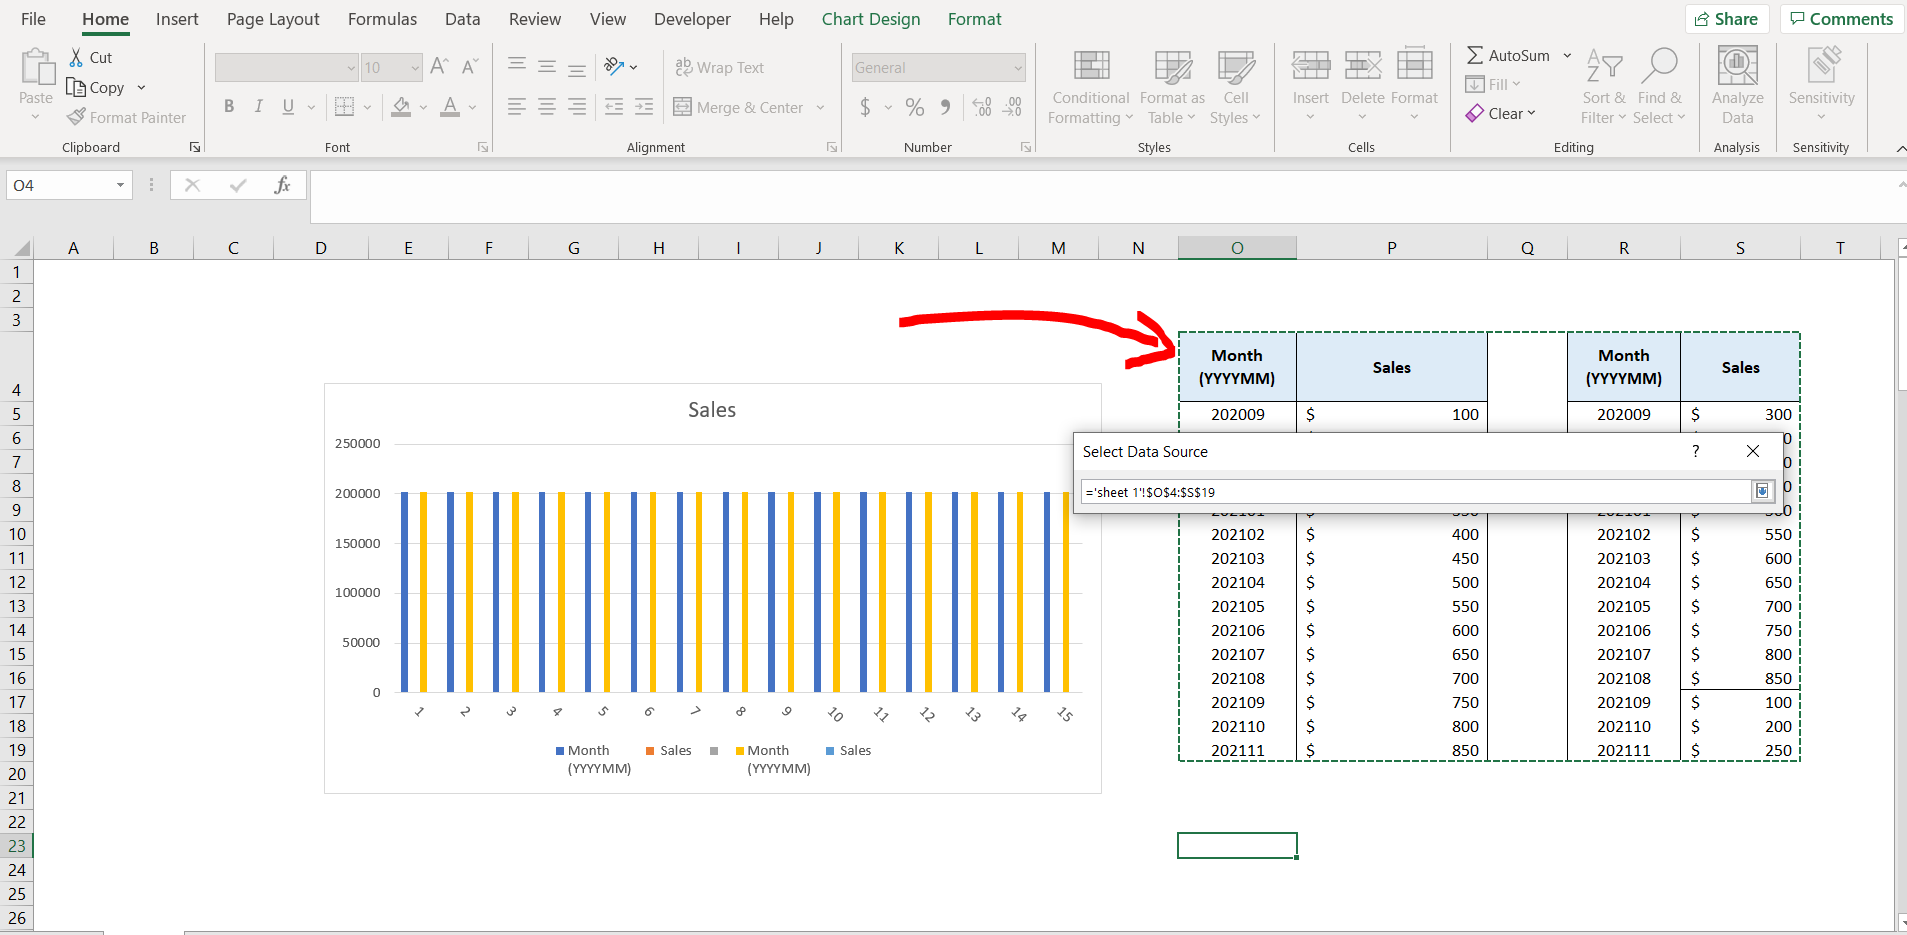
– Select all the data which needs to be included in the graph, and hit Enter.
Step 5 – Removing unwanted data
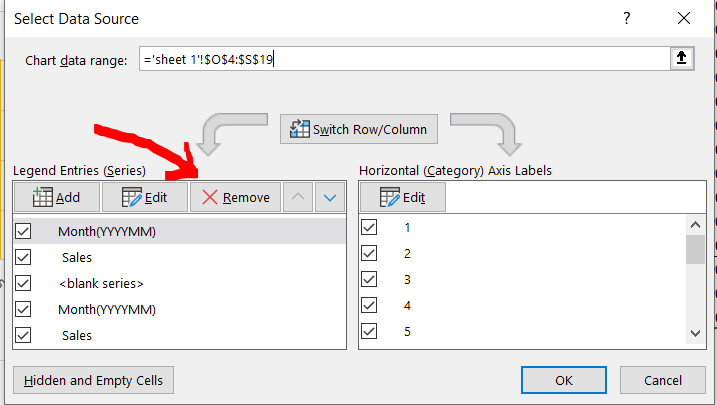
– Now remove the unwanted data, and keep the relevant data only, by selecting the unwanted data header and clicking in “Remove” as shown in the image above, and then click on “OK”.
Step 6 – Data added to the graph
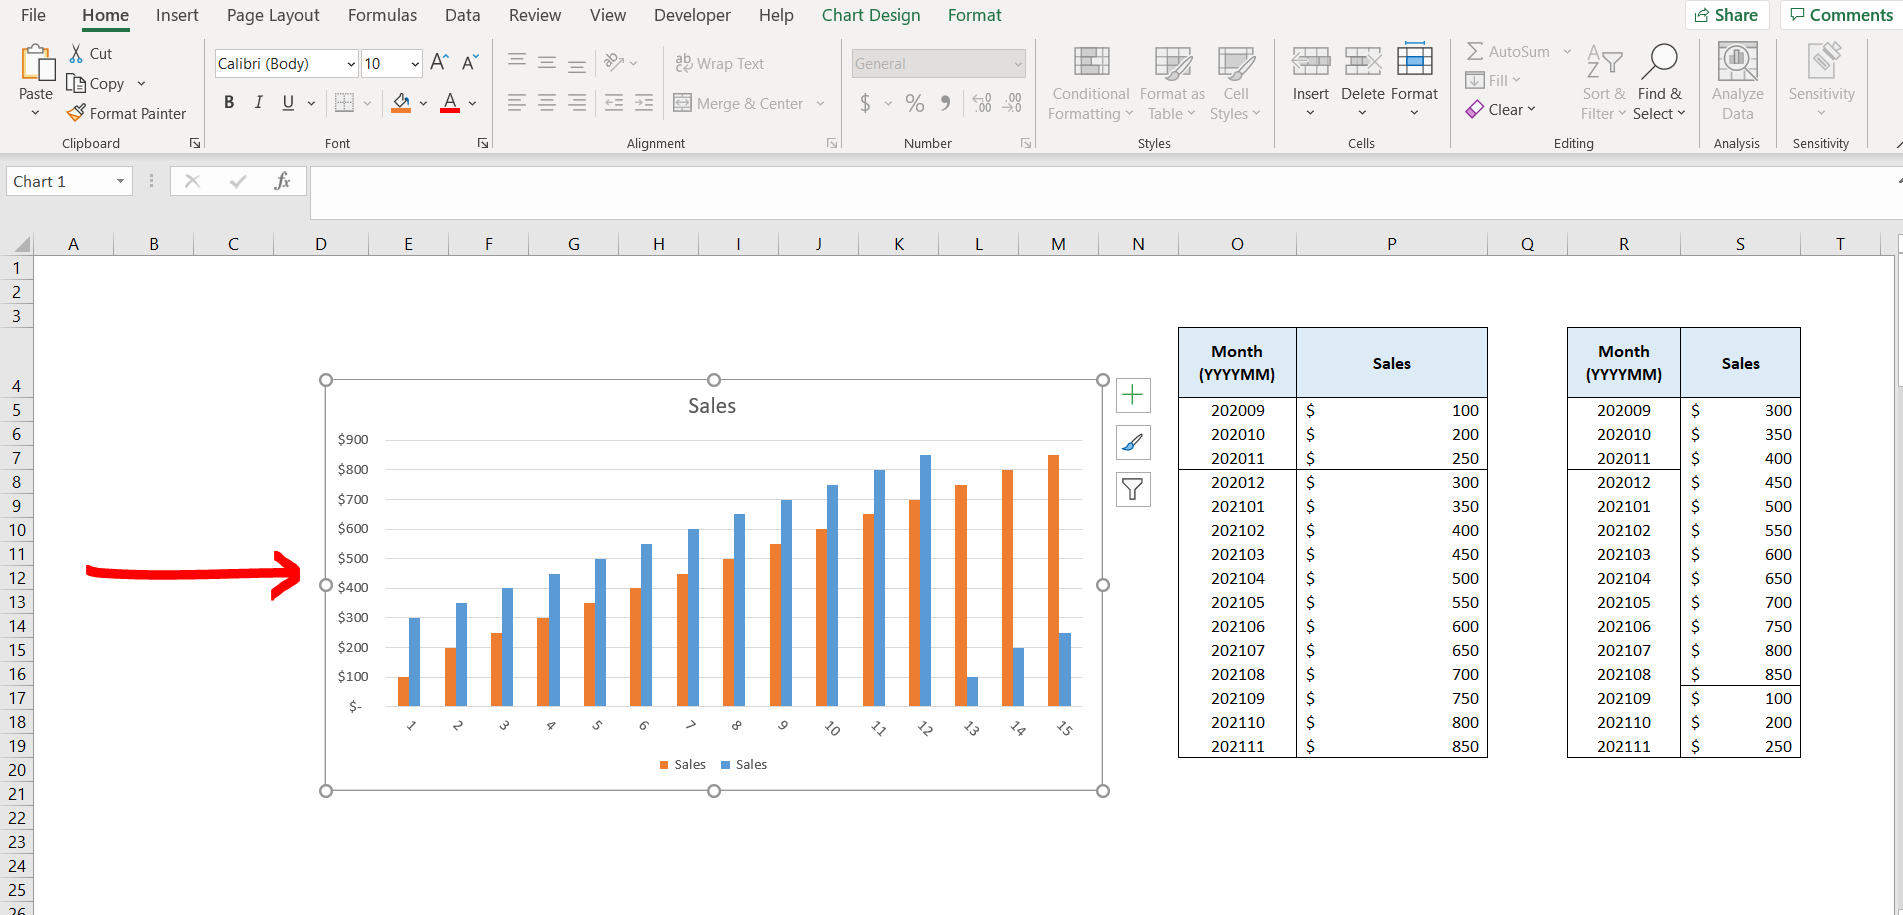
– Now we can see that the sales data from both set of data have been added to our graph.


