
How to add tick marks in an Excel graph
 By
SpreadCheaters
By
SpreadCheaters
You can watch a video tutorial here.
Charts are a great way to visualize data and perform data analysis. Excel has several options when it comes to creating and formatting charts. One such formatting option is to add tick marks to the chart. Tick marks are small lines on the axis that correspond to the data label on the axis. This makes it easier to understand which label corresponds to which data point in the chart. Both major and minor tick marks can be added. Major tick marks indicate the value of the series and minor tick marks denote all the values in between.
Like many other formatting options in Excel, there are multiple ways in which to add the tick marks. The Format Axis pane is used to add the tick marks and there are several ways in which to open the pane:
- The Chart Elements quick menu
- The Chart Design menu
- The context menu
Option 1 – Use the Chart Elements quick menu
Step 1 – Open the Chart Elements quick menu
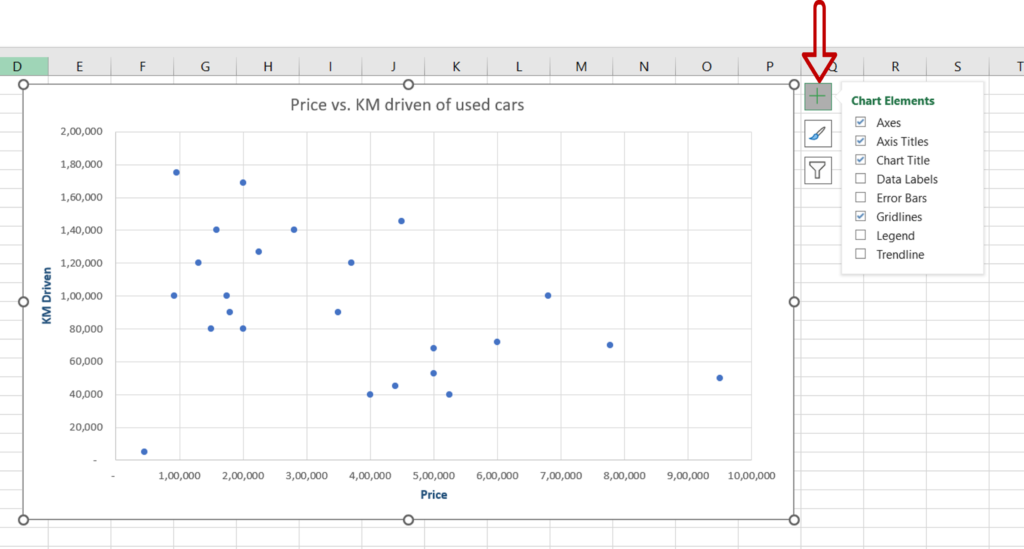
- Select the chart
- Click on the plus sign (+) that appears at the top right corner of the chart
Step 2 – Select the Axes option
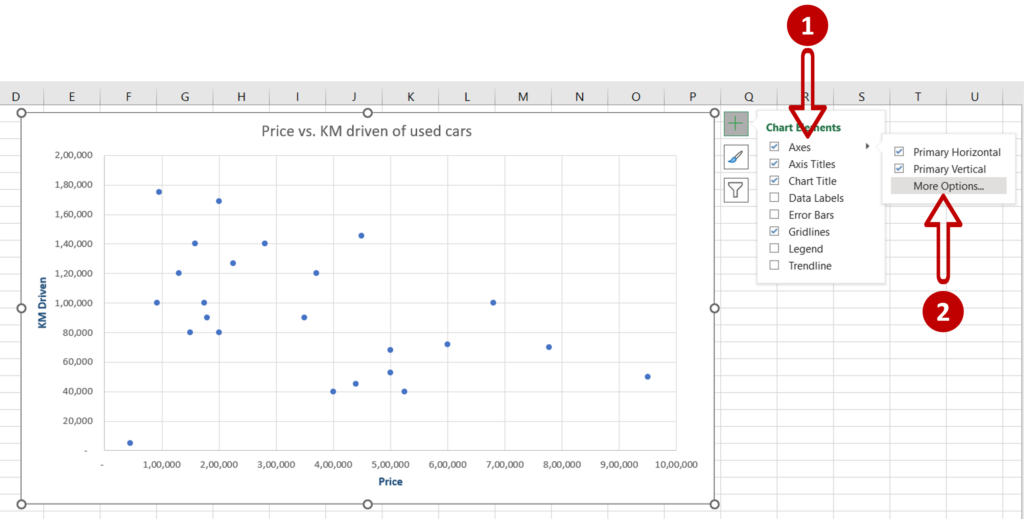
- From the Axes menu, click More Options
Step 3 – Select the axis
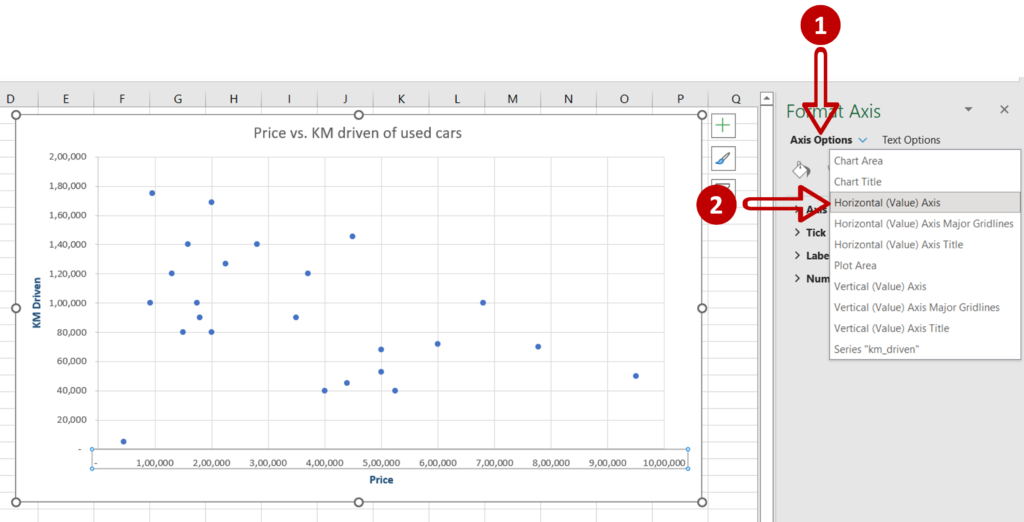
- Expand the Axis Options menu
- Select Horizontal (Value) Axis
Step 4 – Add the tick marks
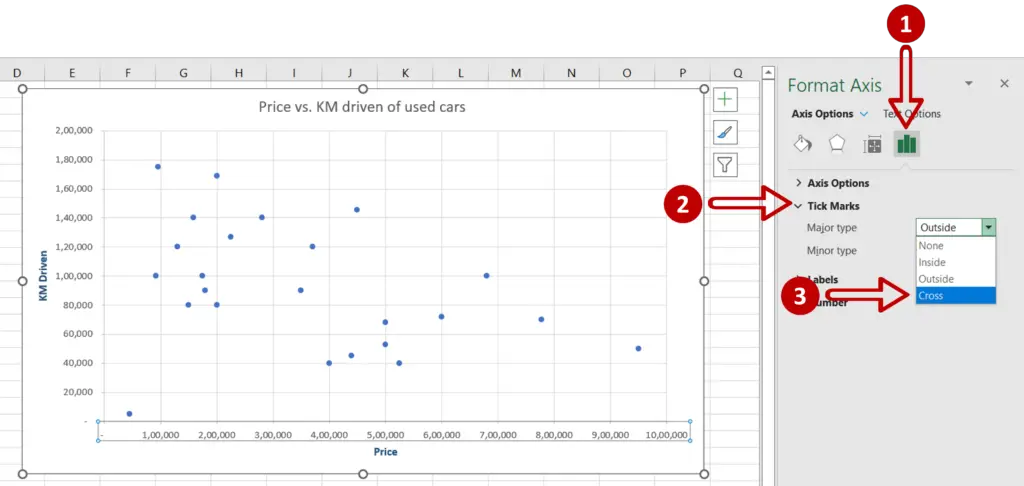
- Select Axis Options
- Expand the Tick Marks menu
- Explore the options for type:
- None: no tick marks are displayed
- Inside: tick marks are displayed above the axis
- Outside: tick marks are displayed below the axis
- Cross: tick marks cross from above to below the axis
- Under Major type select Cross
Option 2 – Use the Chart Design menu
Step 1 – Open the Format Axis pane
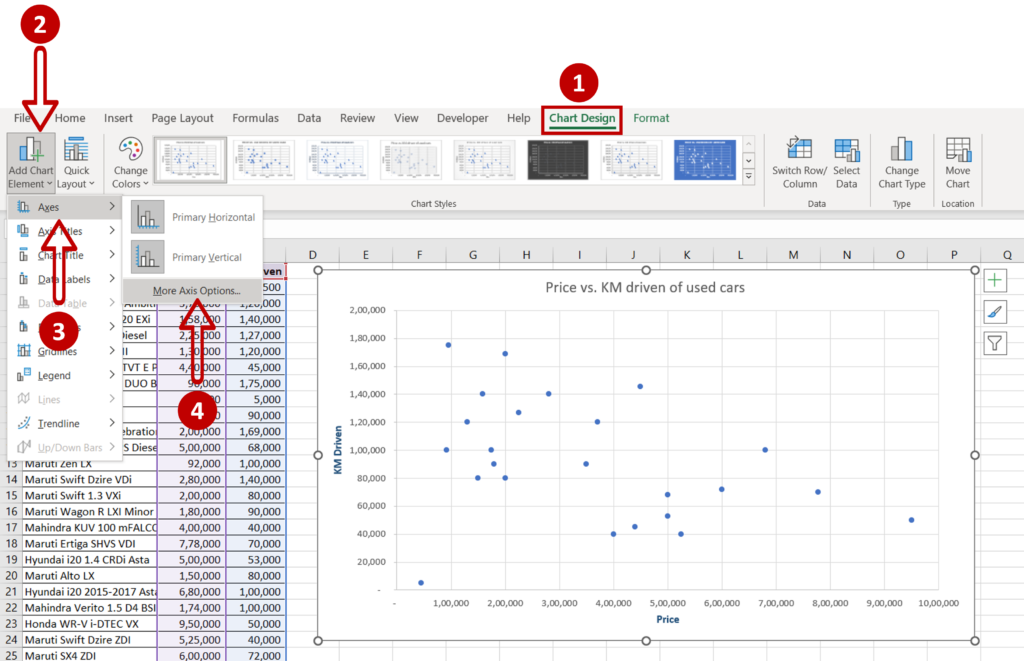
- Select the chart
- Go to Chart Design > Add Chart Element > Axes
- Click on More Axis Options
Step 2 – Select the axis

- Expand the Axis Options menu
- Select Horizontal (Value) Axis
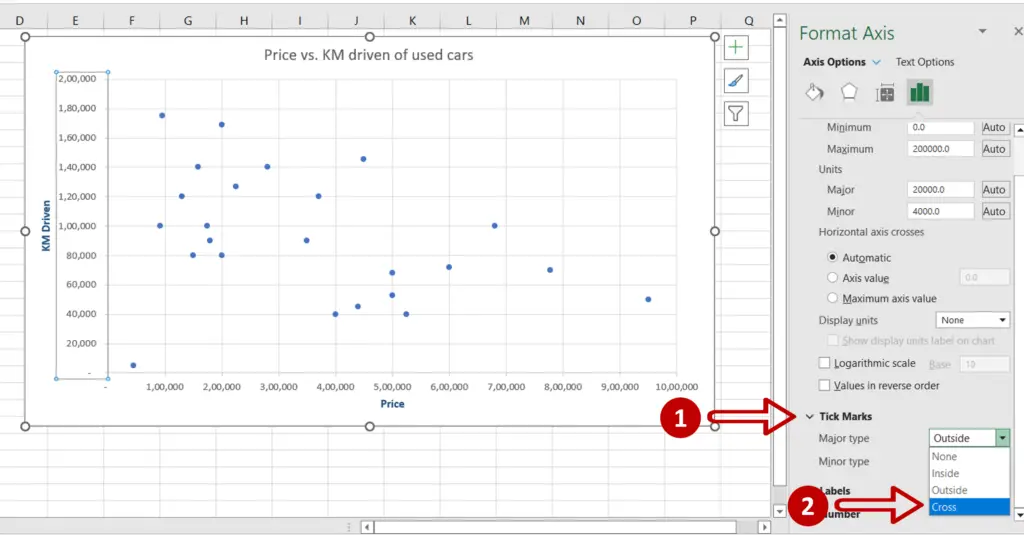
Step 3 – Add the tick marks

- Select Axis Options
- Expand the Tick Marks menu
- Explore the options for type:
- None: no tick marks are displayed
- Inside: tick marks are displayed above the axis
- Outside: tick marks are displayed below the axis
- Cross: tick marks cross from above to below the axis
- Under Major type select Cross
Option 3 – Use the context menu
Step 1 – Open the Format Axis pane
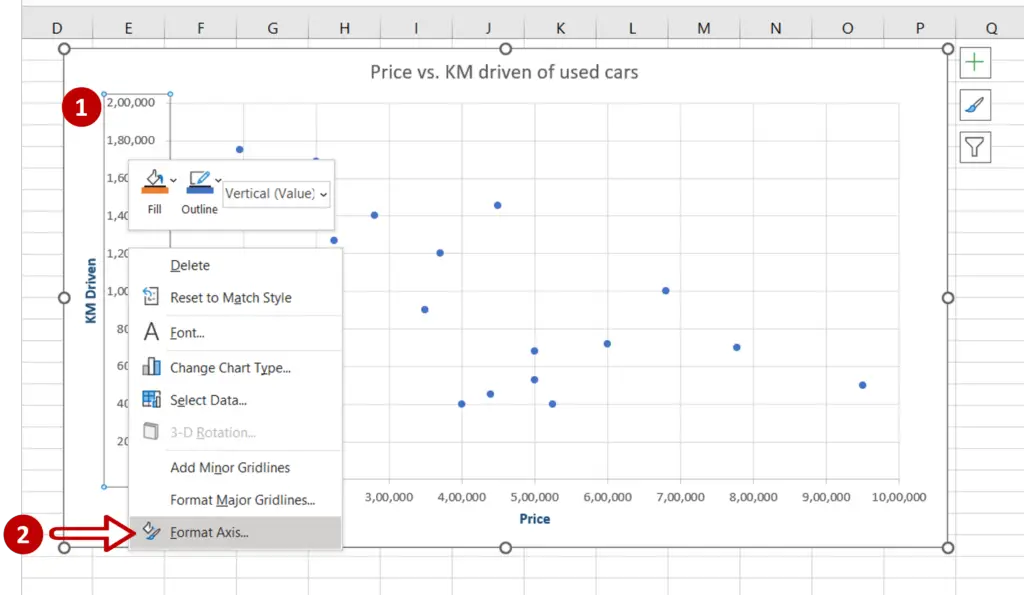
- Select the axis to which the tick marks are to be added
- Right-click and select Format Axis from the context menu
Step 2 – Add the tick marks
- Expand the Tick Marks menu
- Explore the options for type:
- None: no tick marks are displayed
- Inside: tick marks are displayed above the axis
- Outside: tick marks are displayed below the axis
- Cross: tick marks cross from above to below the axis
- Under Major type select Cross


