
How to add percentages to pie chart in Excel
 By
SpreadCheaters
By
SpreadCheaters
The pie chart is a good graph to represent, for example, how the sales of a company are split among the different countries. As default the data are not presented in % but it is simple to add this feature. To add percentages to a pie chart in Excel proceed as follows.
Step 1 – Select the pie chart
– Select the graph where you want to add percentages.
Step 2 – Add the percentages
– Navigate to the “chart design” tab;
– Locate the “add chart element” button on the top left of the toolbar;
– Locate the “data labels” option;
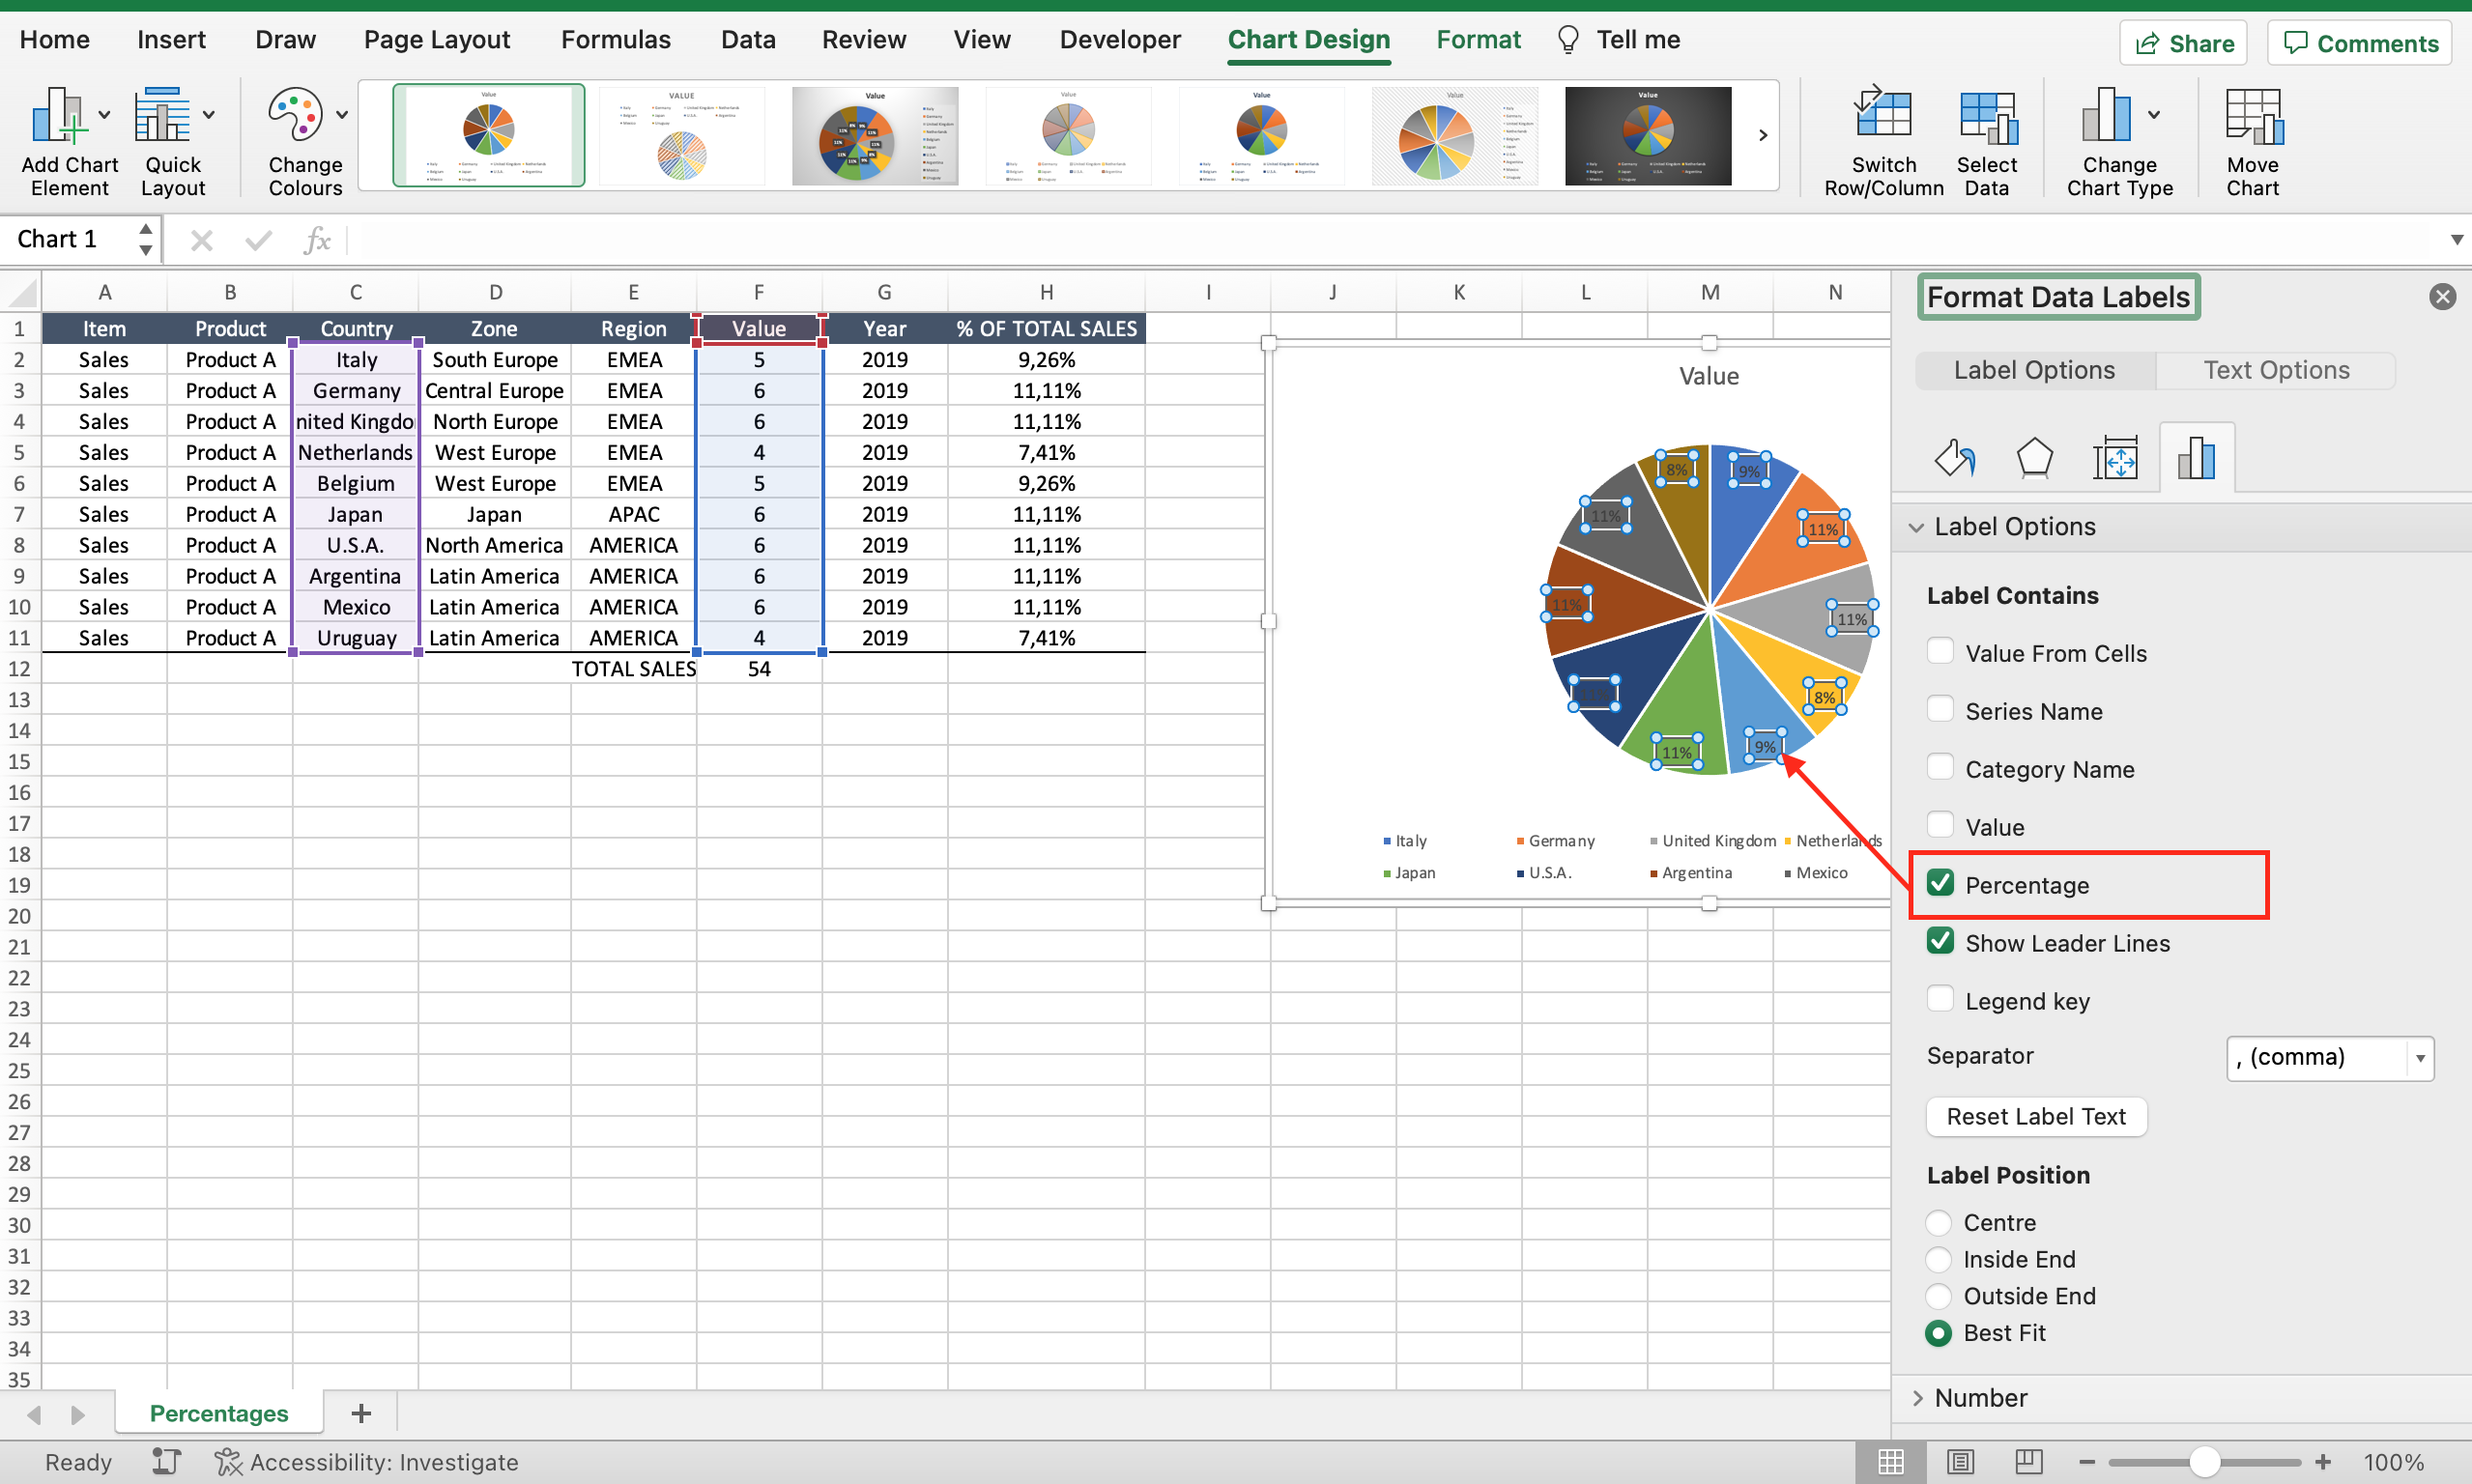
– Select “more data labels options” to open the dialog menu on the right of the worksheet;
– Locate the “label options” section in the dialog menu;
– Tick “percentages” in the “label contain” section. If value is selected as default, remove this selection to see only the percentages;
– Click on the gray cross to close the dialog menu.


