
How to add multiple pivot tables to one sheet in Microsoft Excel
 By
SpreadCheaters
By
SpreadCheaters
Adding multiple pivot tables to one sheet in Excel can be a useful way to summarize and analyze large amounts of data. With multiple pivot tables on the same sheet, you can easily compare and contrast different aspects of your data and identify trends and patterns that may not be immediately apparent from individual tables.
In this tutorial, we will learn how to add multiple pivot tables to one sheet in Microsoft Excel. Adding multiple pivot tables to one sheet in Excel can be done by creating the first pivot table, clicking on a cell where you want to place the second pivot table, and repeating the process for each additional table.
Here we have two distinct data sets. We will create a pivot table for each data set on one sheet.
Method 1: Adding Multiple Pivot Tables From Different Data Sets
Step 1 – Select the Range of Cells
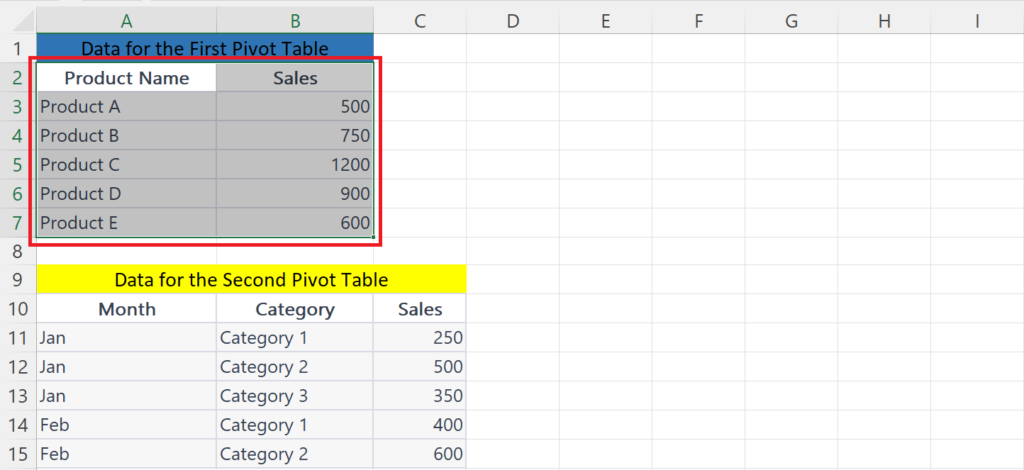
- Select the range of cells containing the source data for the first pivot table.
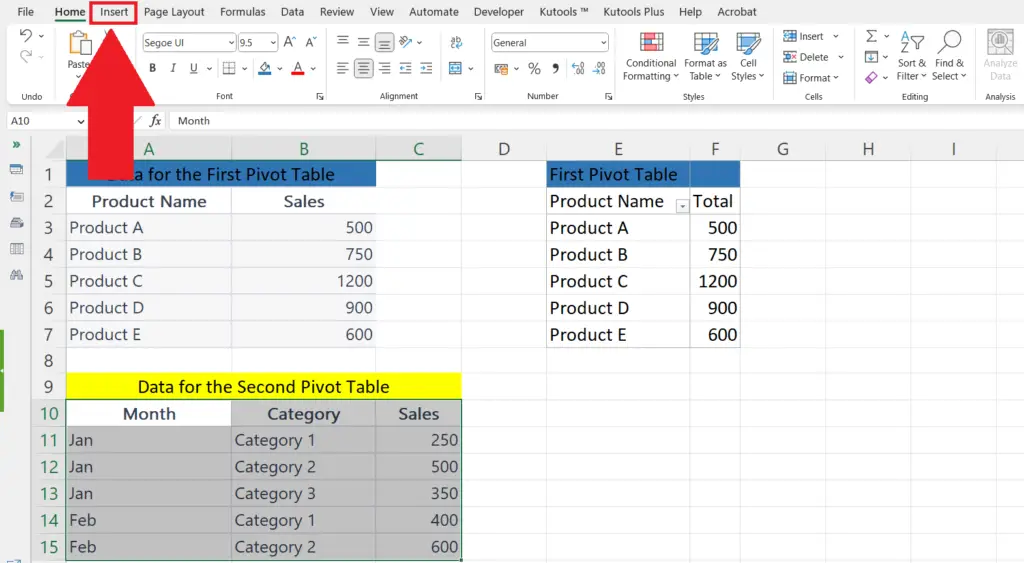
Step 2 – Go to the Insert Tab
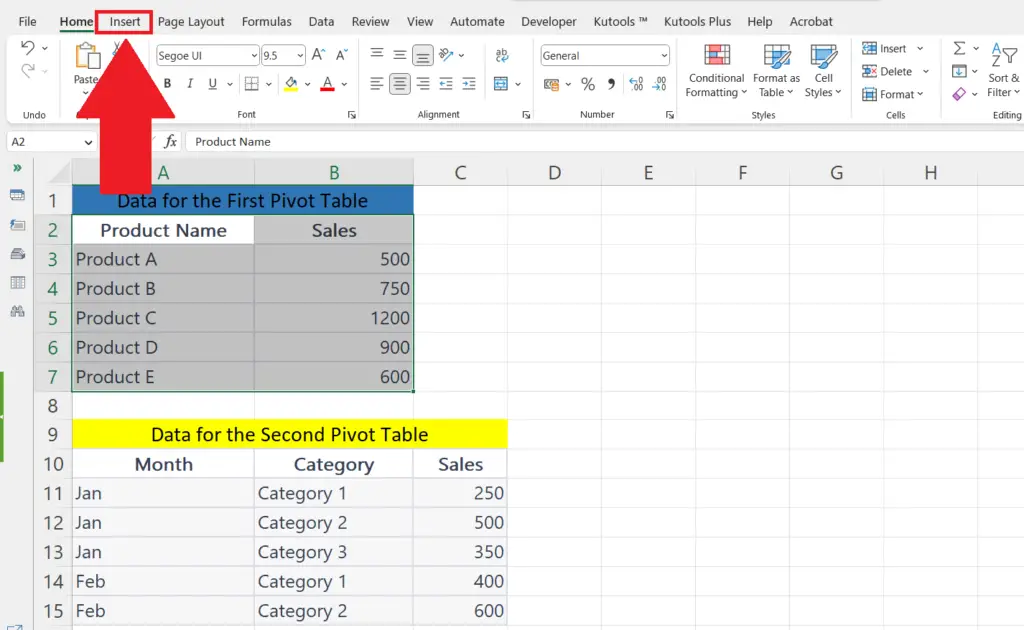
- Go to the Insert tab in the menu bar.
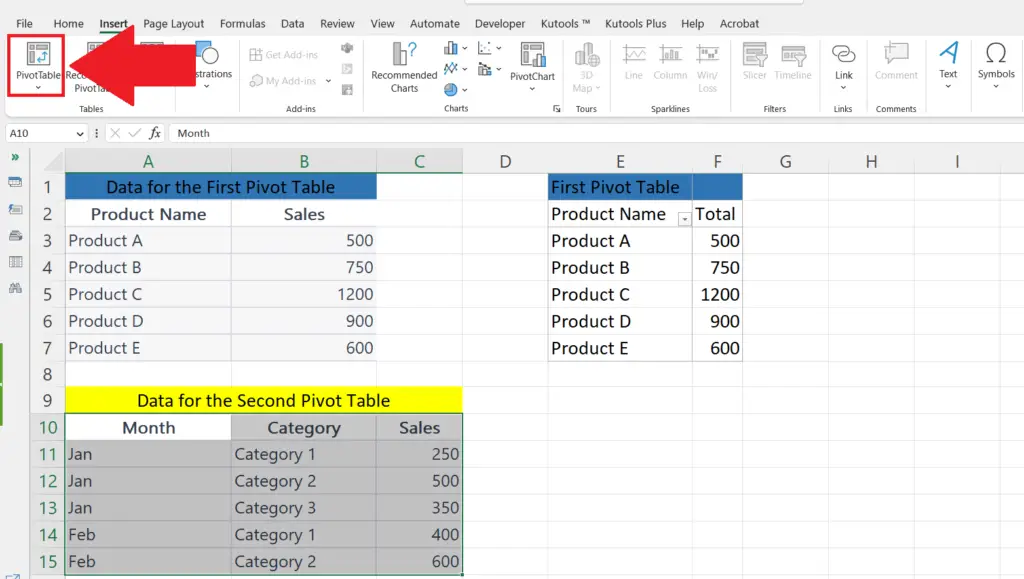
Step 3 – Click on the PivotTable Button
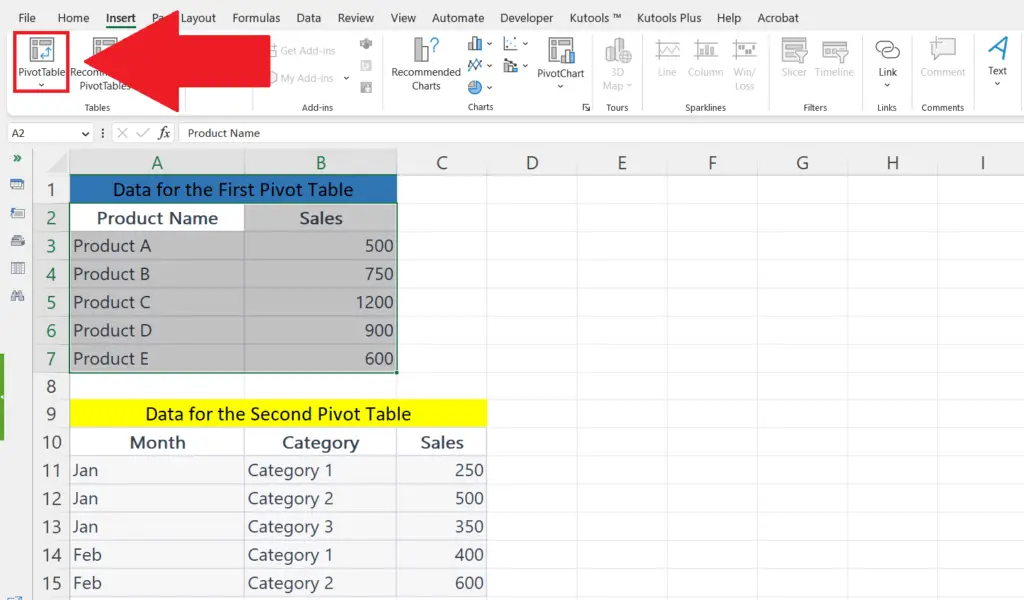
- Click on the PivotTable button on the right end of the ribbon.
- The “PivotTable from table or range” dialog box will appear.
Step 4 – Select the Existing worksheet Option and Enter the Location
- Select the Existing worksheet option.
- Enter the location where you want to place the pivot table.
Step 5 – Click on OK
- Click on OK in the dialog box.
- The first pivot table will be created.
Step 6 – Select the Range of Cells
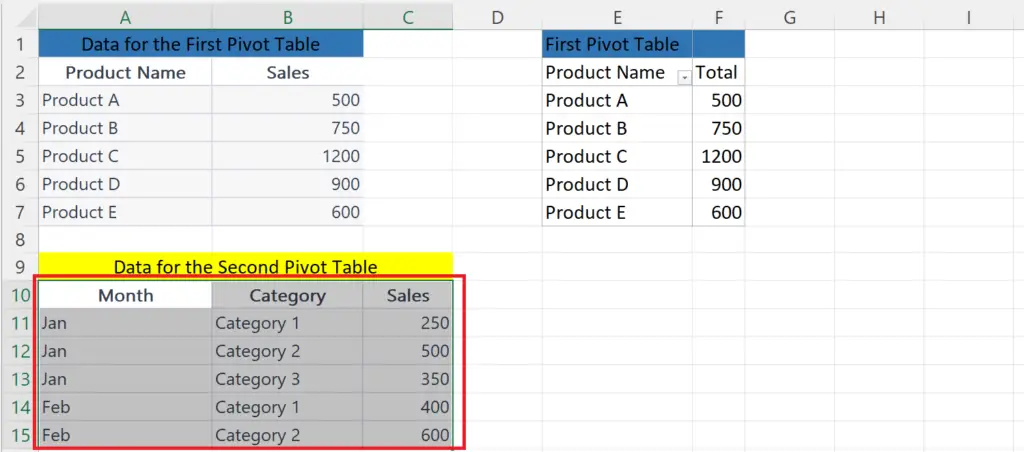
- Select the range of cells containing the source data for the second pivot table.
Step 7 – Go to the Insert Tab
- Go to the Insert tab in the menu bar.
Step 8 – Click on the PivotTable Button
- Click on the PivotTable button on the right end of the ribbon.
- The “PivotTable from table or range” dialog box will appear.
Step 9 – Select the Existing worksheet Option and Enter the Location
- Select the Existing worksheet option.
- Enter the location where you want to place the pivot table.
Step 10 – Click on OK
- Click on OK in the dialog box.
- The second pivot table will be created.
Method 2: Adding Multiple Pivot Tables From the Same Data Set for Different Fields
For this method, we will use a data set that represents Sales of products of two categories i.e. Electronics and Fashion done by three salespersons i.e. John, Sarah, and Mary.
We will add two pivot tables i.e. one representing the total sales by each salesperson and the other, representing the total sales of each product.
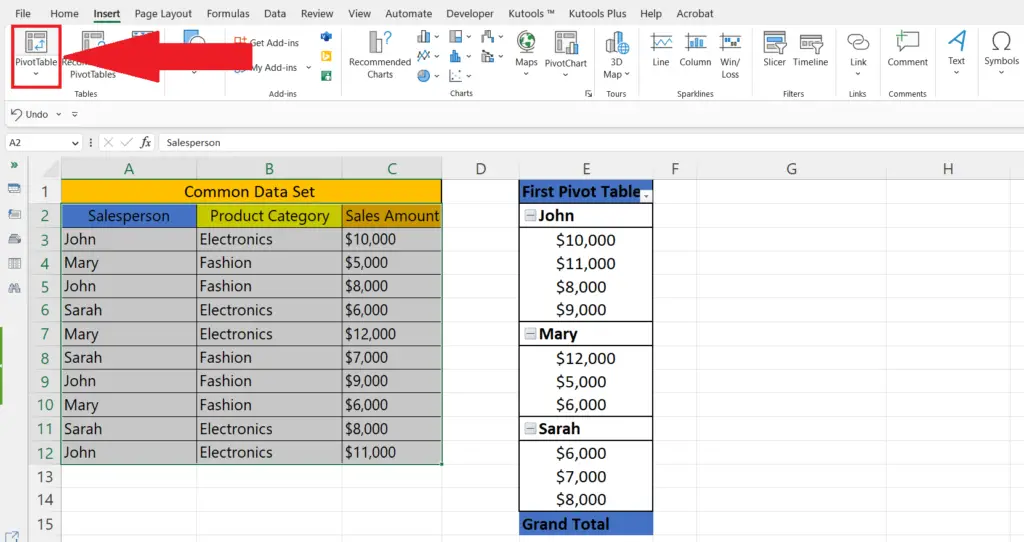
Step 1 – Select the Data Range
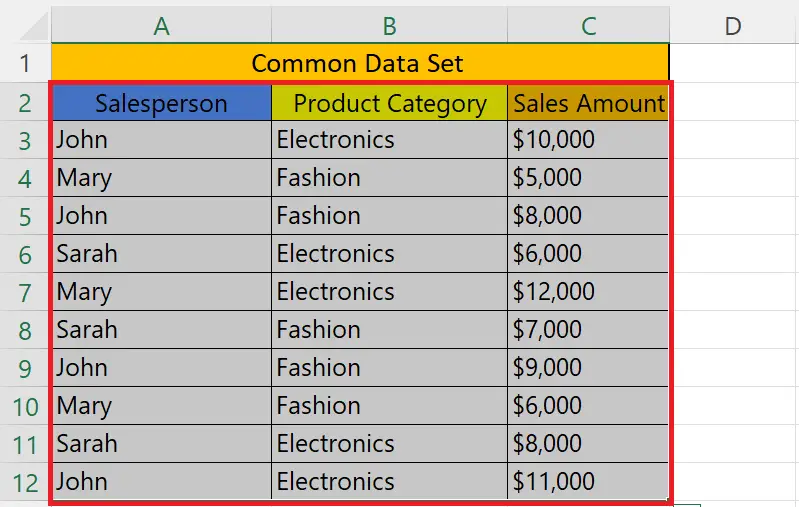
- Select the range of cells containing the data set from which we want to make multiple pivot tables.
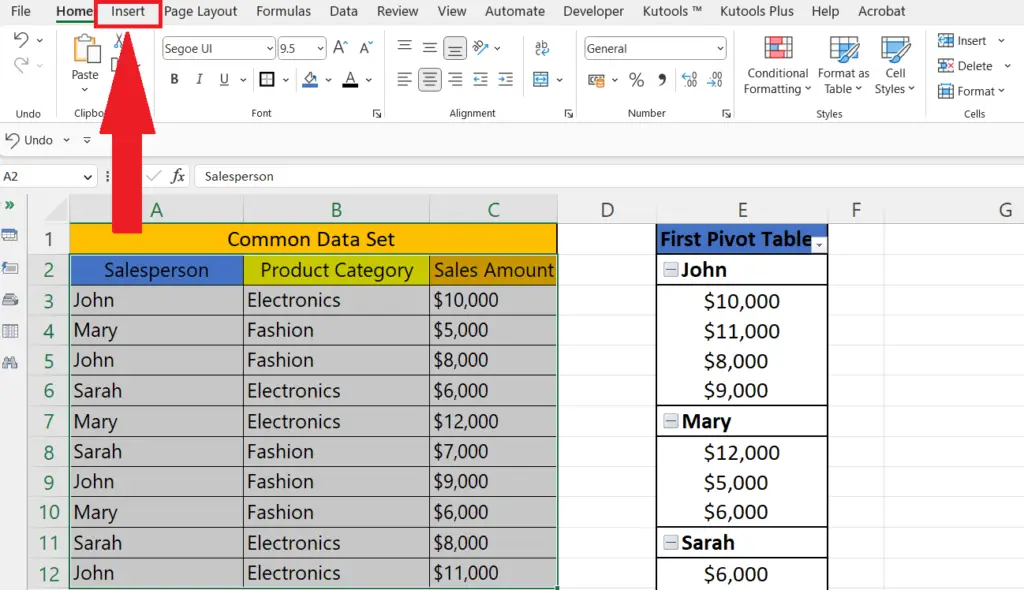
Step 2 – Go to the Insert Tab
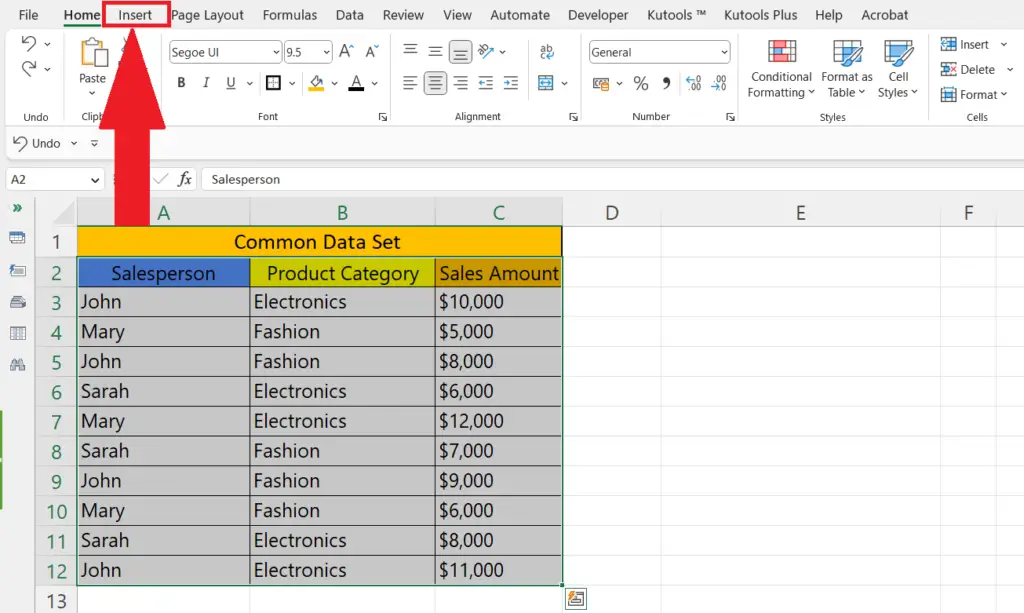
- Go to the Insert tab in the menu bar.
Step 3 – Click on the Pivot Table Button
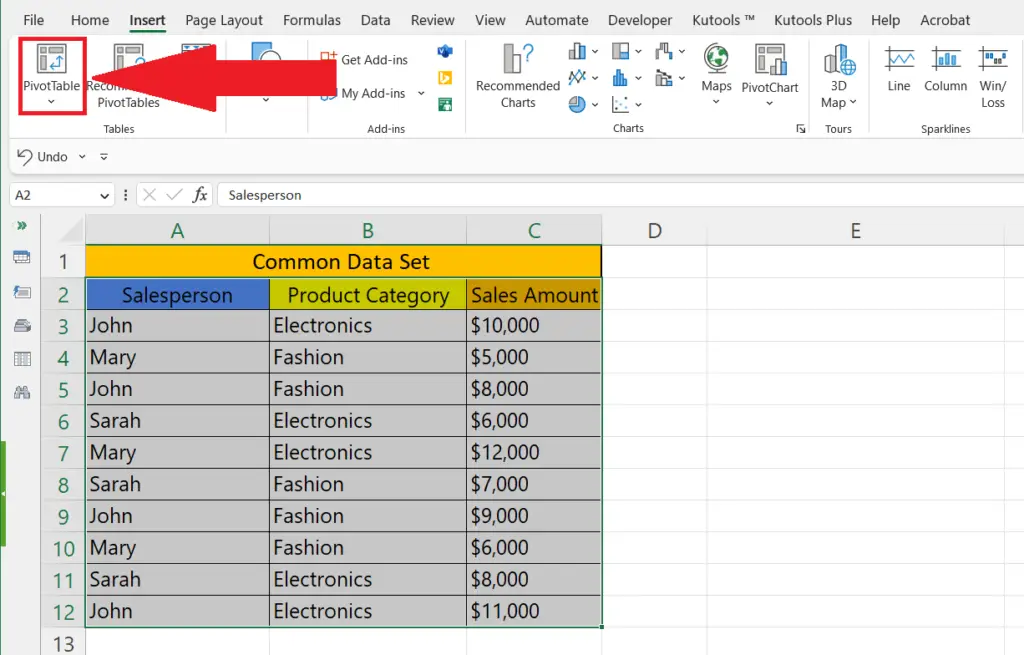
- Click on the Pivot table button at the left end of the ribbon.
Step 4 – Insert the First Pivot Table
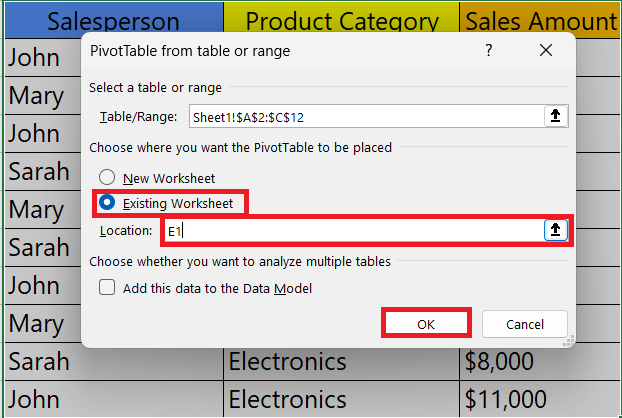
- A dialog box will appear.
- Select the “Existing Worksheet” option and enter the location i.e. E1.
- Click on OK.
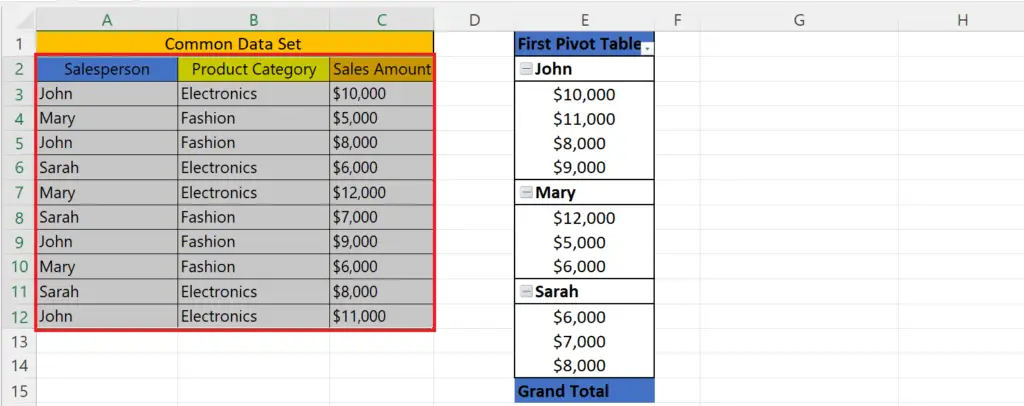
Step 5 – Add the Fields for the First Pivot Table
- Add the field for the first pivot table i.e. Sales Person and Sales amount.
- For this, just check the boxes with each option.
- The First pivot table will be added, representing the total sales of each person.
Step 6 – Again Select the Data Range
- Select the range of cells containing the data set from which we want to make multiple pivot tables for the second pivot table.
Step 7 – Go to the Insert Tab
- Go to the Insert tab in the menu bar.
Step 8 – Click on the Pivot Table Button
- Click on the Pivot table button at the left end of the ribbon.
Step 9 – Insert the Second Pivot Table
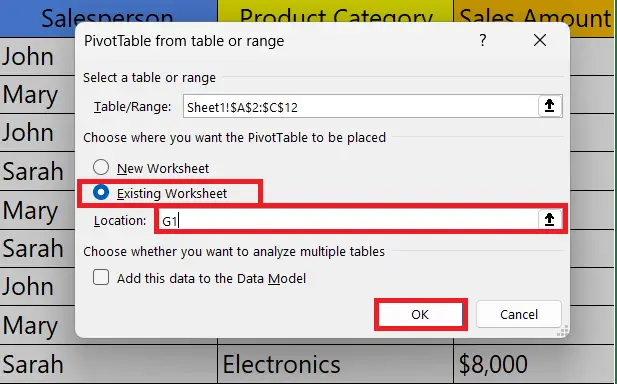
- A dialog box will appear.
- Select the “Existing Worksheet” option and enter the location i.e. G1.
- Click on OK.
Step 10 – Add the Fields for the Second Pivot Table
- Add the field for the second pivot table i.e. Product Category and Sales amount.
- For this, just check the boxes with each option.
- The Second pivot table will be added, representing the total sales of each product category.


