
How to add labels to axis in Excel
 By
SpreadCheaters
By
SpreadCheaters
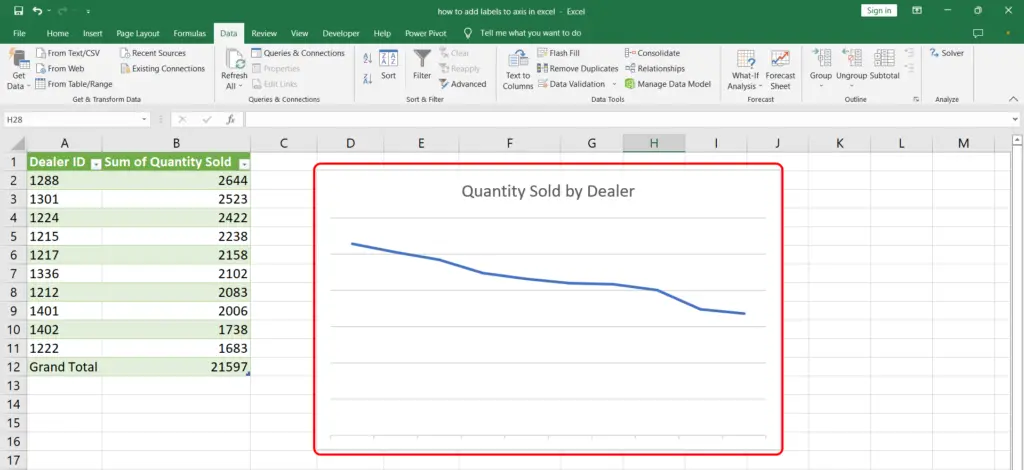
We have a chart showing the quantity of cars sold by dealers in our excel worksheet as shown. However, there are no axis labels. Let’s add axis labels to the chart.
Excel provides fantastic visualization tools for data. The variety is ever increasing with great customization options. One such option is being able to add labels to an axis on a chart. Let’s find out how.
Step 1 – Open Chart Elements menu
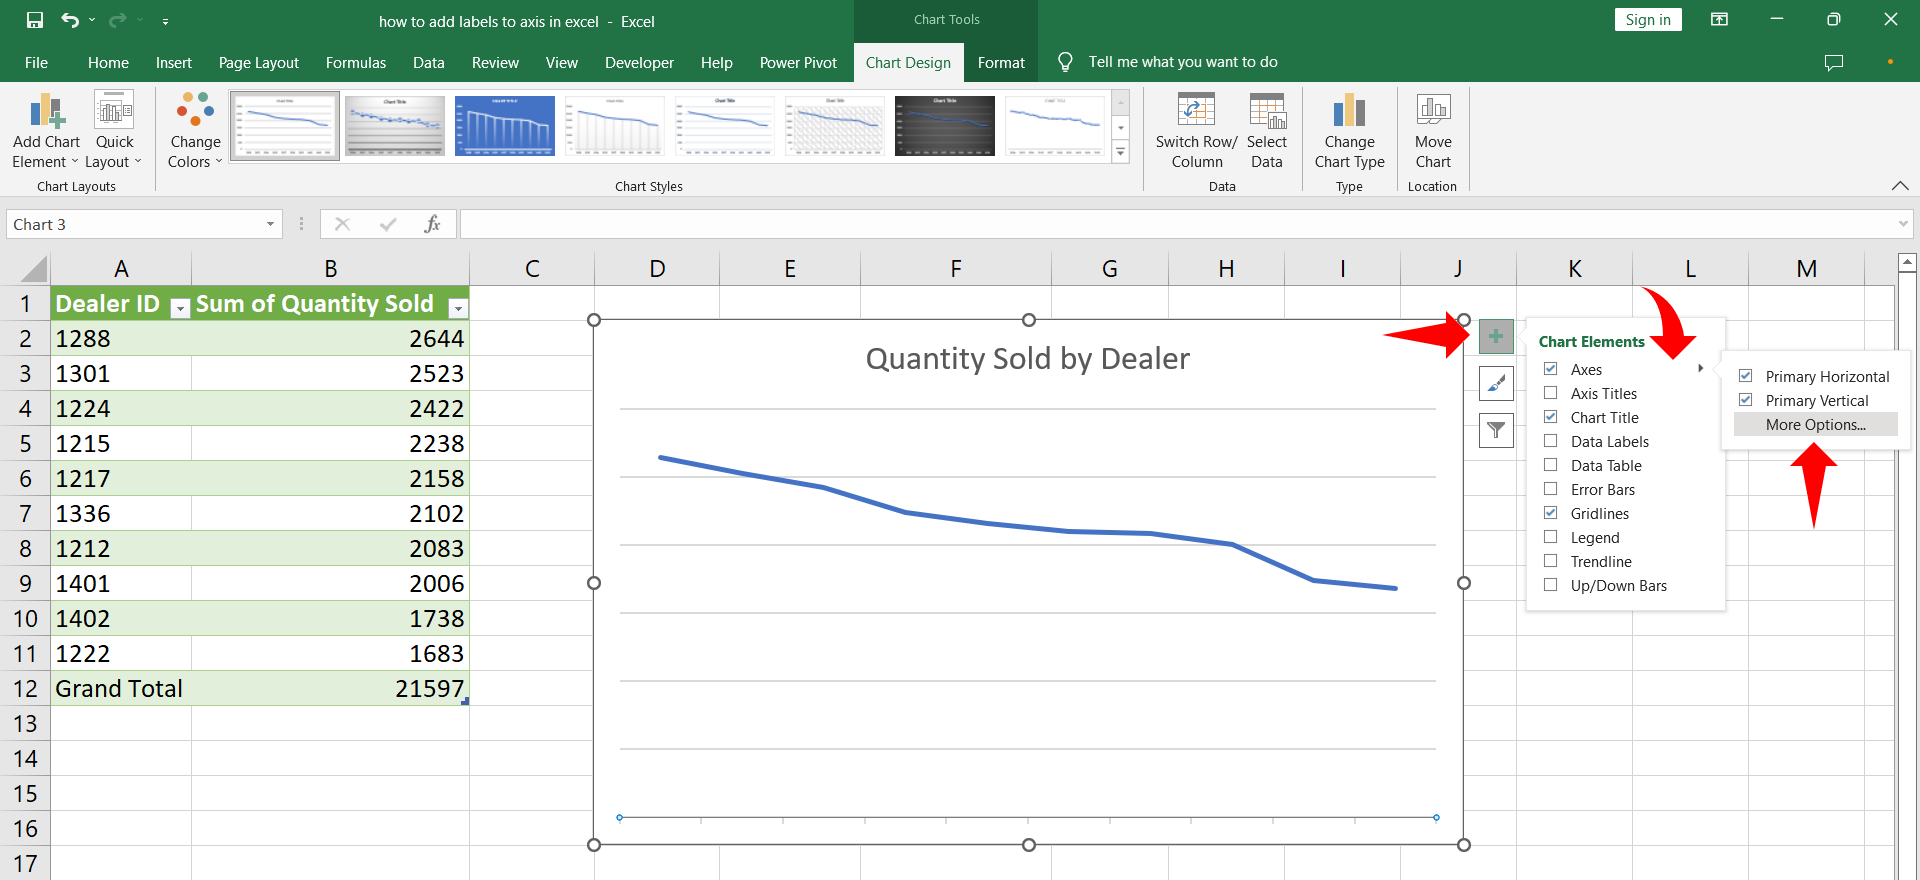
– Click the chart to show the chart context menu.
– Click the plus sign for the Chart Elements and hover on the Axes checkbox to reveal the arrow for options.
– Click the arrow and then click More Options.
– Format Axis menu will appear.
Step 2 – Horizontal Axis labels
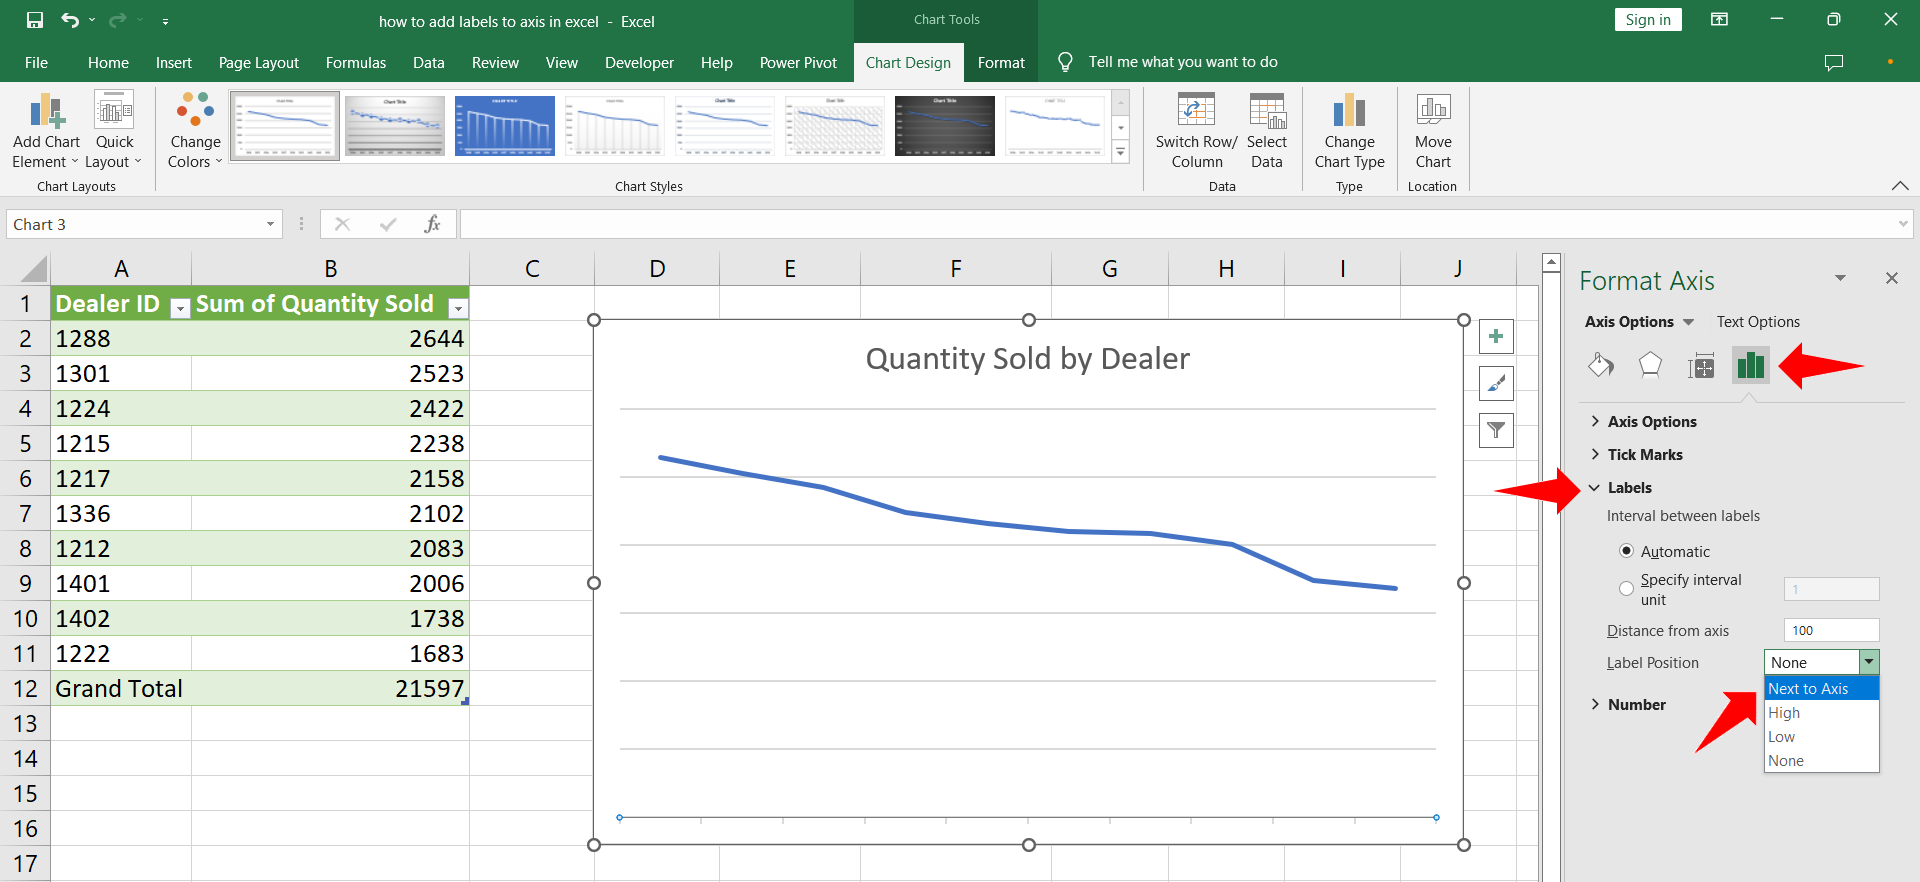
– Under the Format Axis menu click on the drop down menu next to Axis Options and select Horizontal (Category) Axis or Axis Options icon.
– Click the Labels drop down menu.
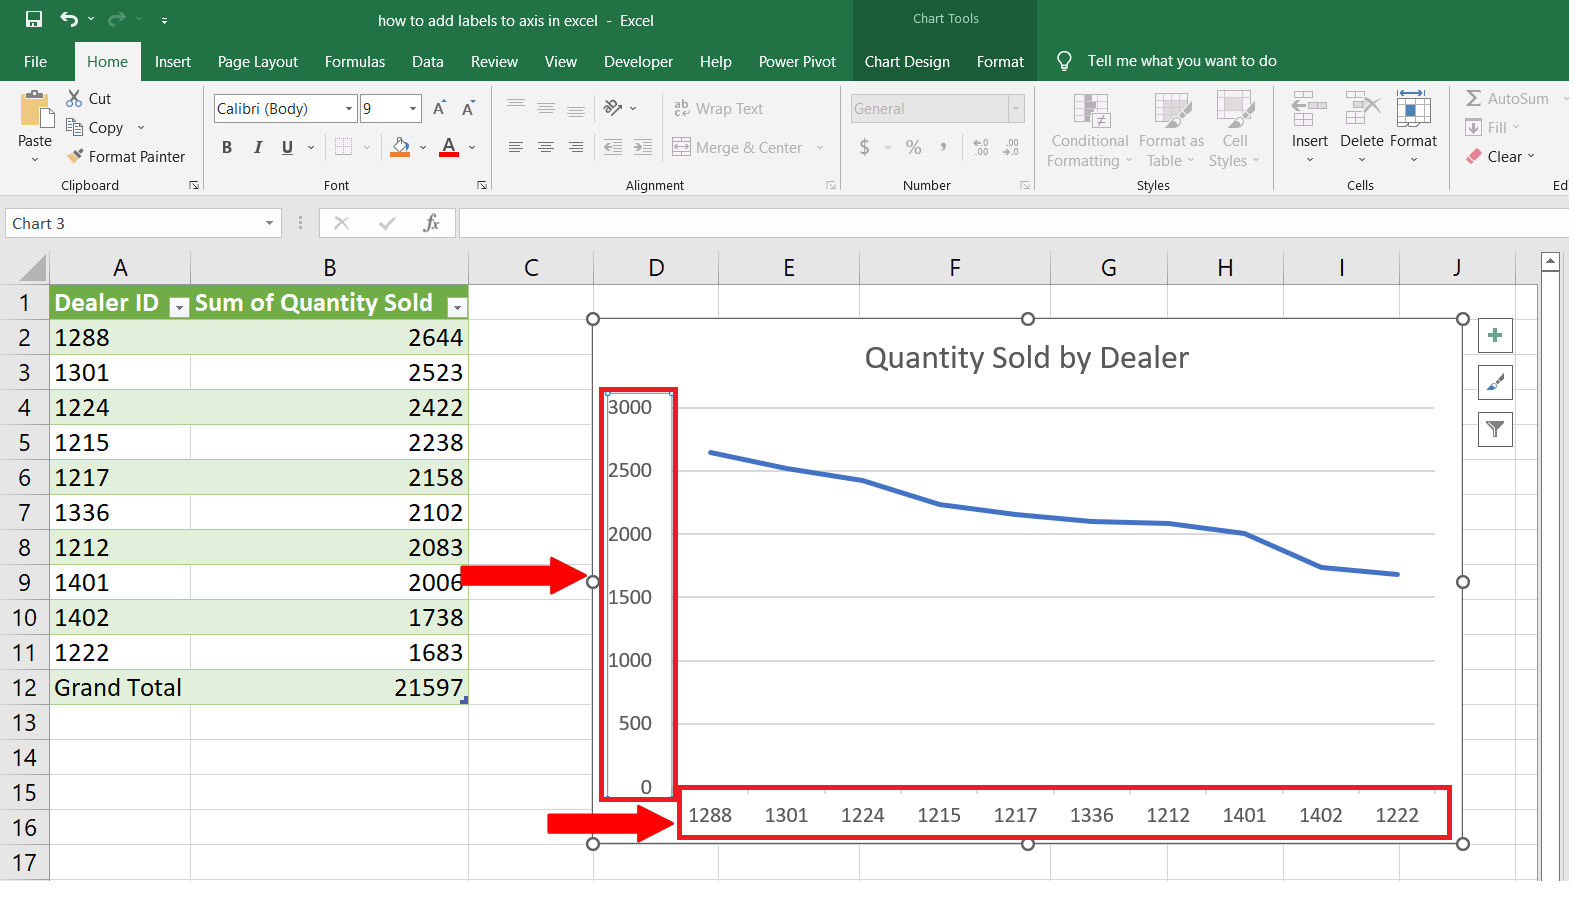
– Click the Label Position menu and select Next to Axis. Horizontal axis labels will be added to the chart.
Step 3 – Vertical Axis labels
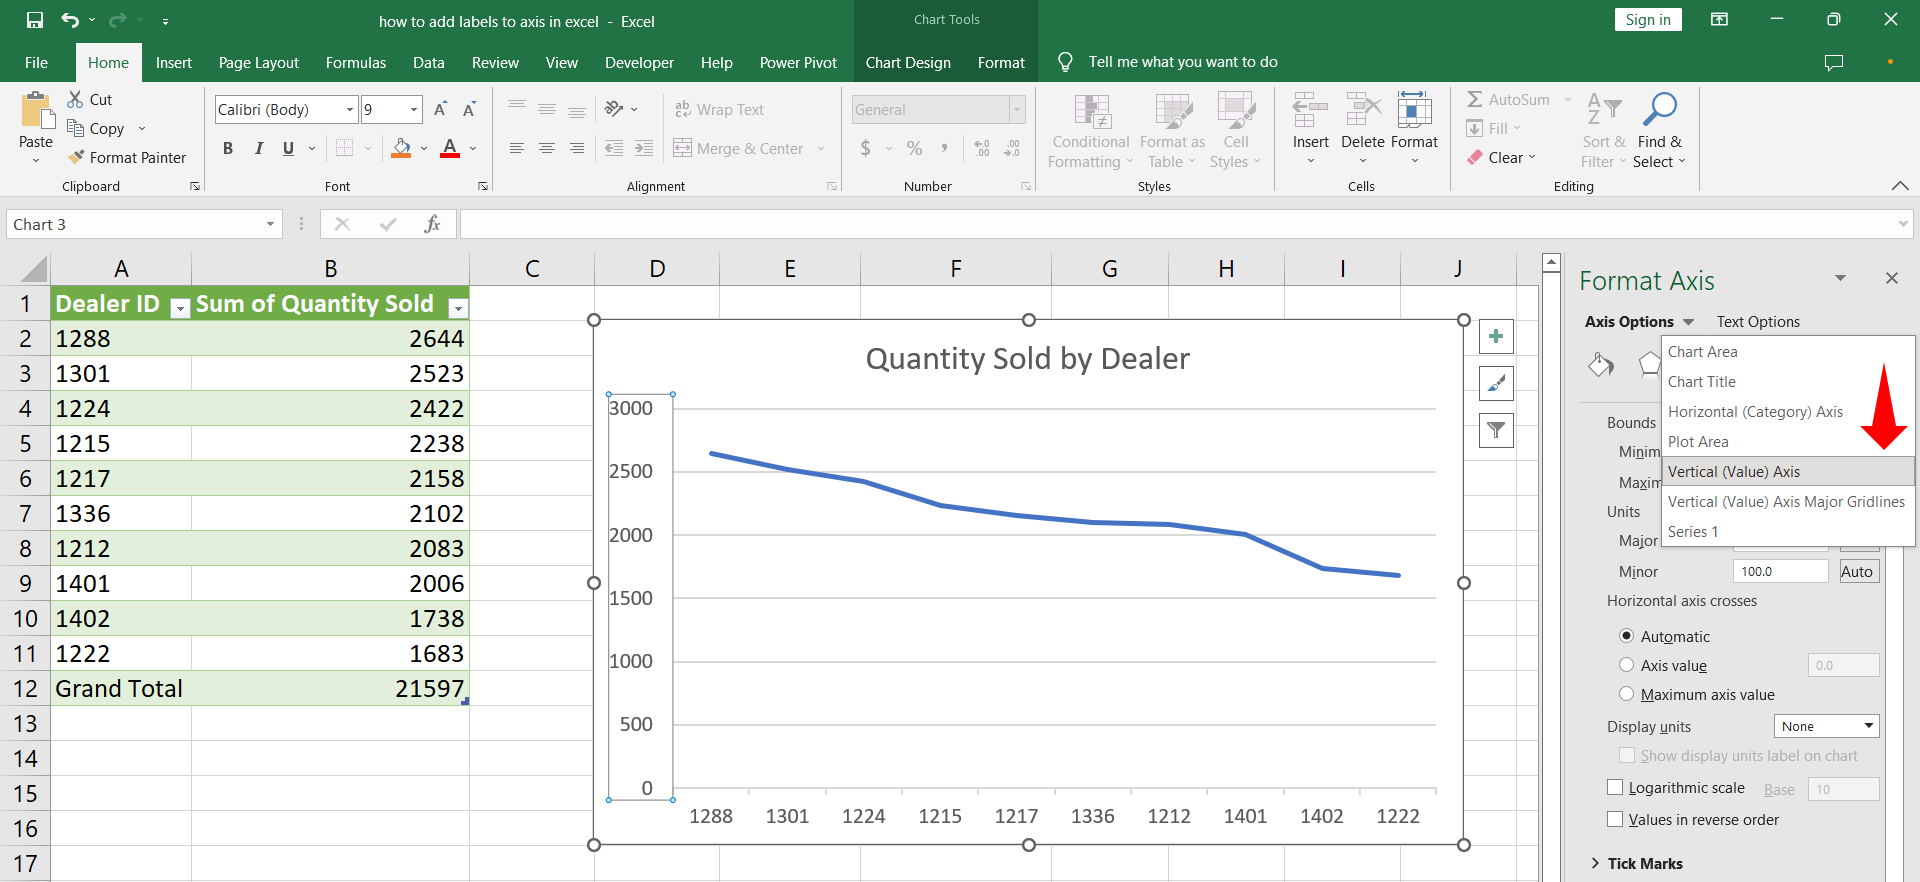
– In order to add vertical axis labels click the drop down menu next to Axis Options and click Vertical (Value) Axis.
– Click the Labels drop down menu.
– Click the Label Position menu and select Next to Axis.
– Vertical axis labels will be added to the chart.


