
How to add equation to graph in excel
 By
SpreadCheaters
By
SpreadCheaters
Page last updated:
26/10/2022 |
Next review date:
26/10/2024
You have a graph you need to add an equation to.
There’s an easy way to do this:
Step 1 – Setting the chart elements
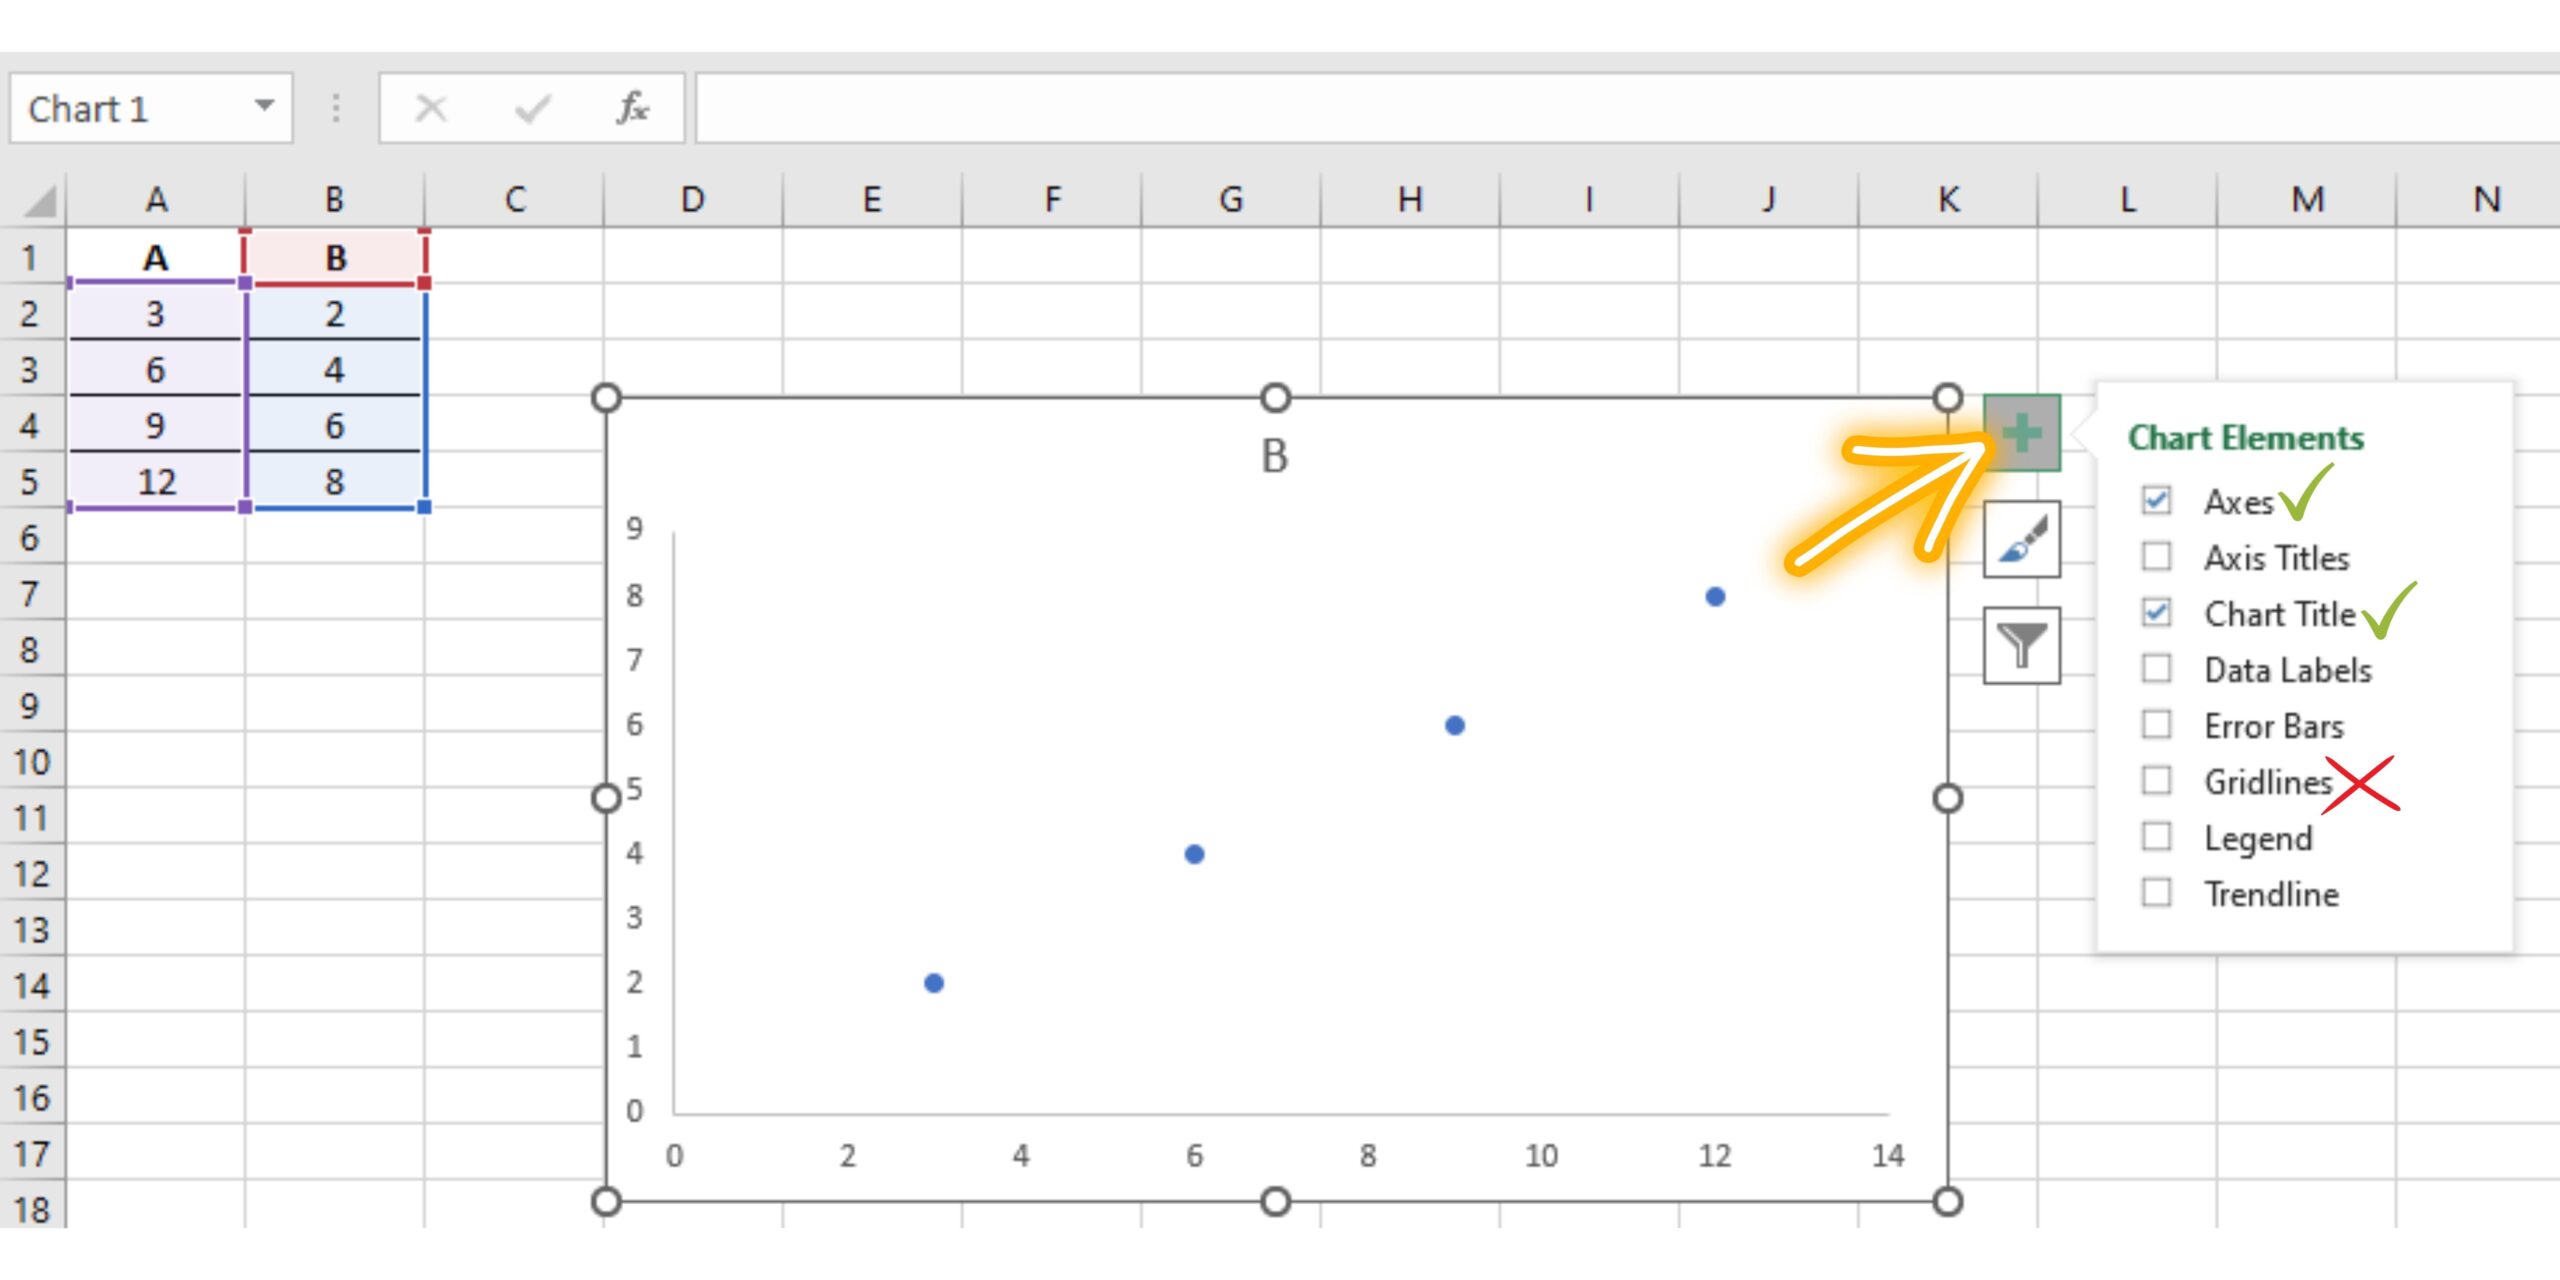
– Click on the chart.
– Click on the + sign in the top right corner.
– Ensure the following boxes are ticked:
—– Axes
—– Chart Title
– Untick Gridlines.
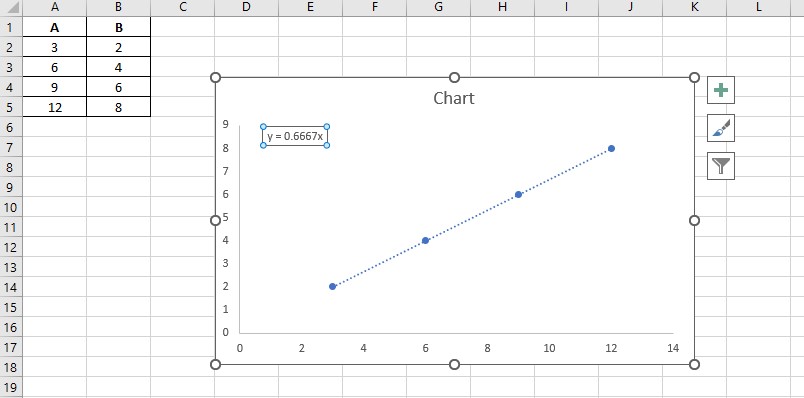
Step 2 – Add the Equation to the chart
– Right-click on any of the data points on the chart.
– Click on Add Trendline.
– Tick the box next to Display Equation on chart.
This is a quick and easy way to add an equation to a graph in Excel.


