
How to add data points to an existing graph in excel
 By
SpreadCheaters
By
SpreadCheaters
You can watch a video tutorial here.

Graphs are great ways to visualize data and Excel has tools to build many types of graphs. Having created a graph, you may need to enhance it by adding more data. In this example, a line chart has been created using two columns of data – one is the year and the other is the Profit. We now need to add the Bonus figures as well, but this number appears only for 2002 and 2008. If we try to add the Bonus figures as a line, they will not be displayed because there are no numbers for them to connect to. A line cannot be drawn connecting both points because it will then seem like the numbers in between the points correspond to the years in between. Instead, we will add them as data points that will be displayed against the years 2002 and 2008.
Step 1 – Open the Select Data Source box
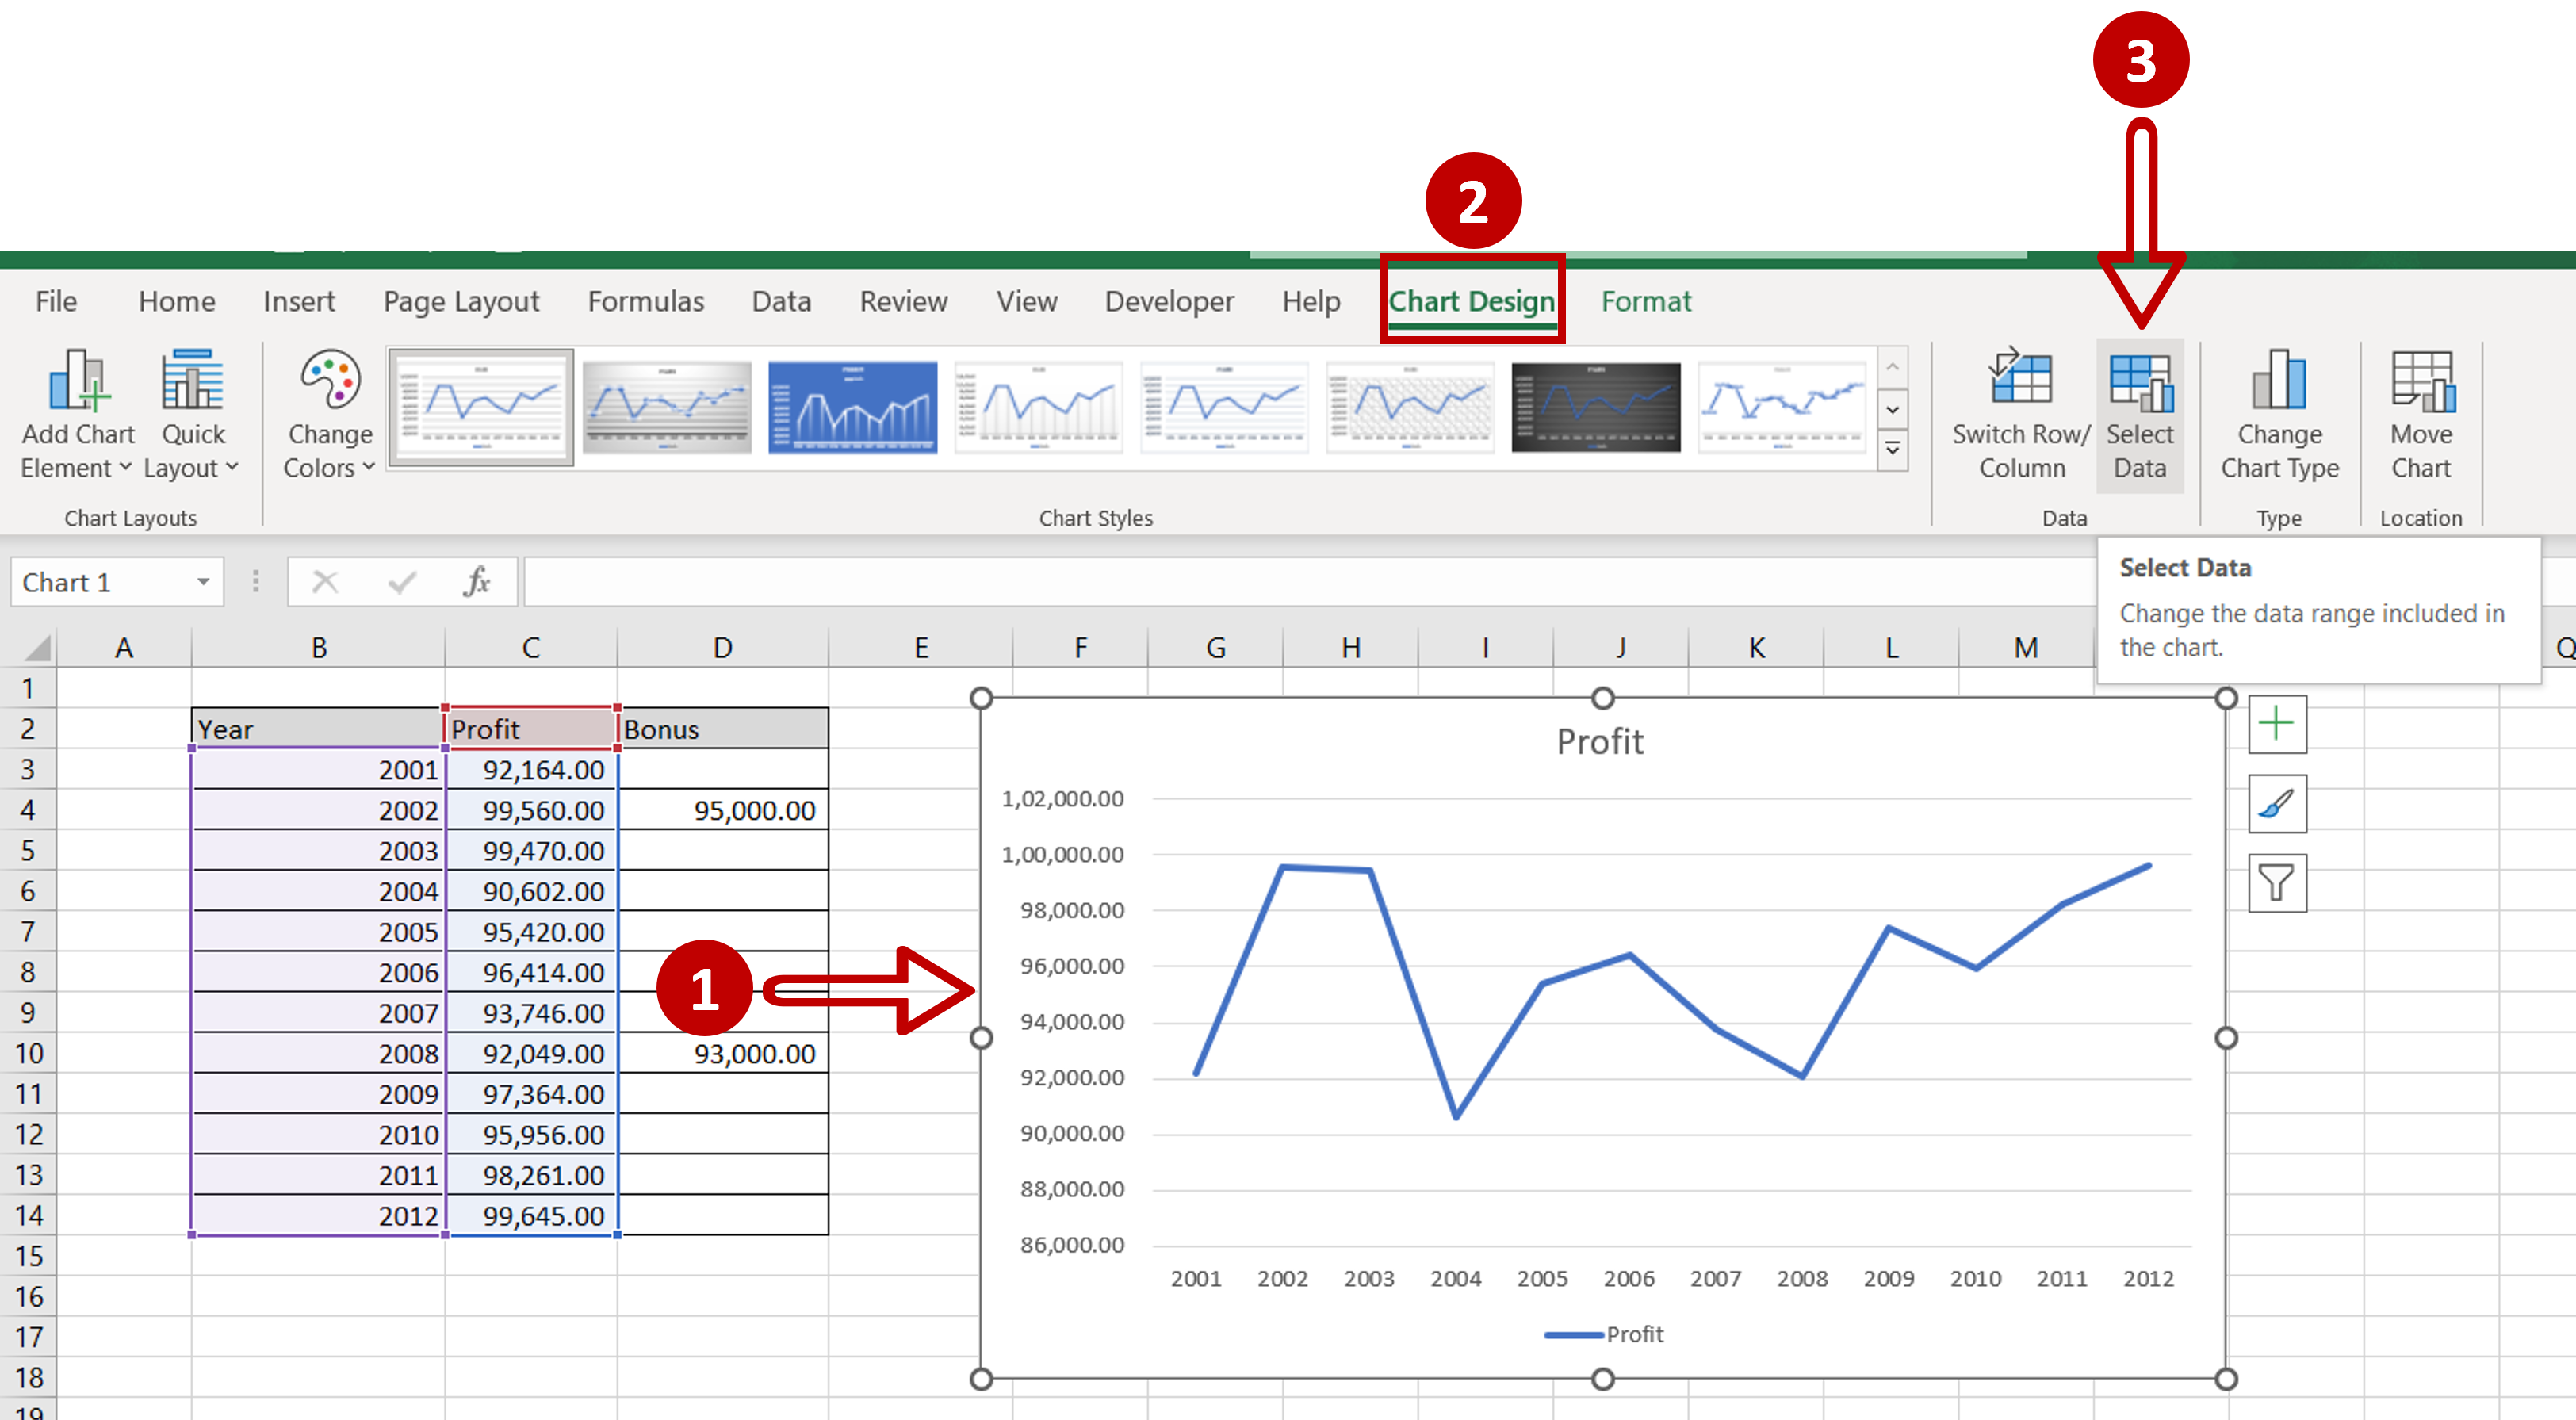
– Select the chart to summon the Chart Design menu
– Go to Data and click on the Select Data button
OR
Right-click and select Select Data from the context menu
Step 2 – Open the Edit series box
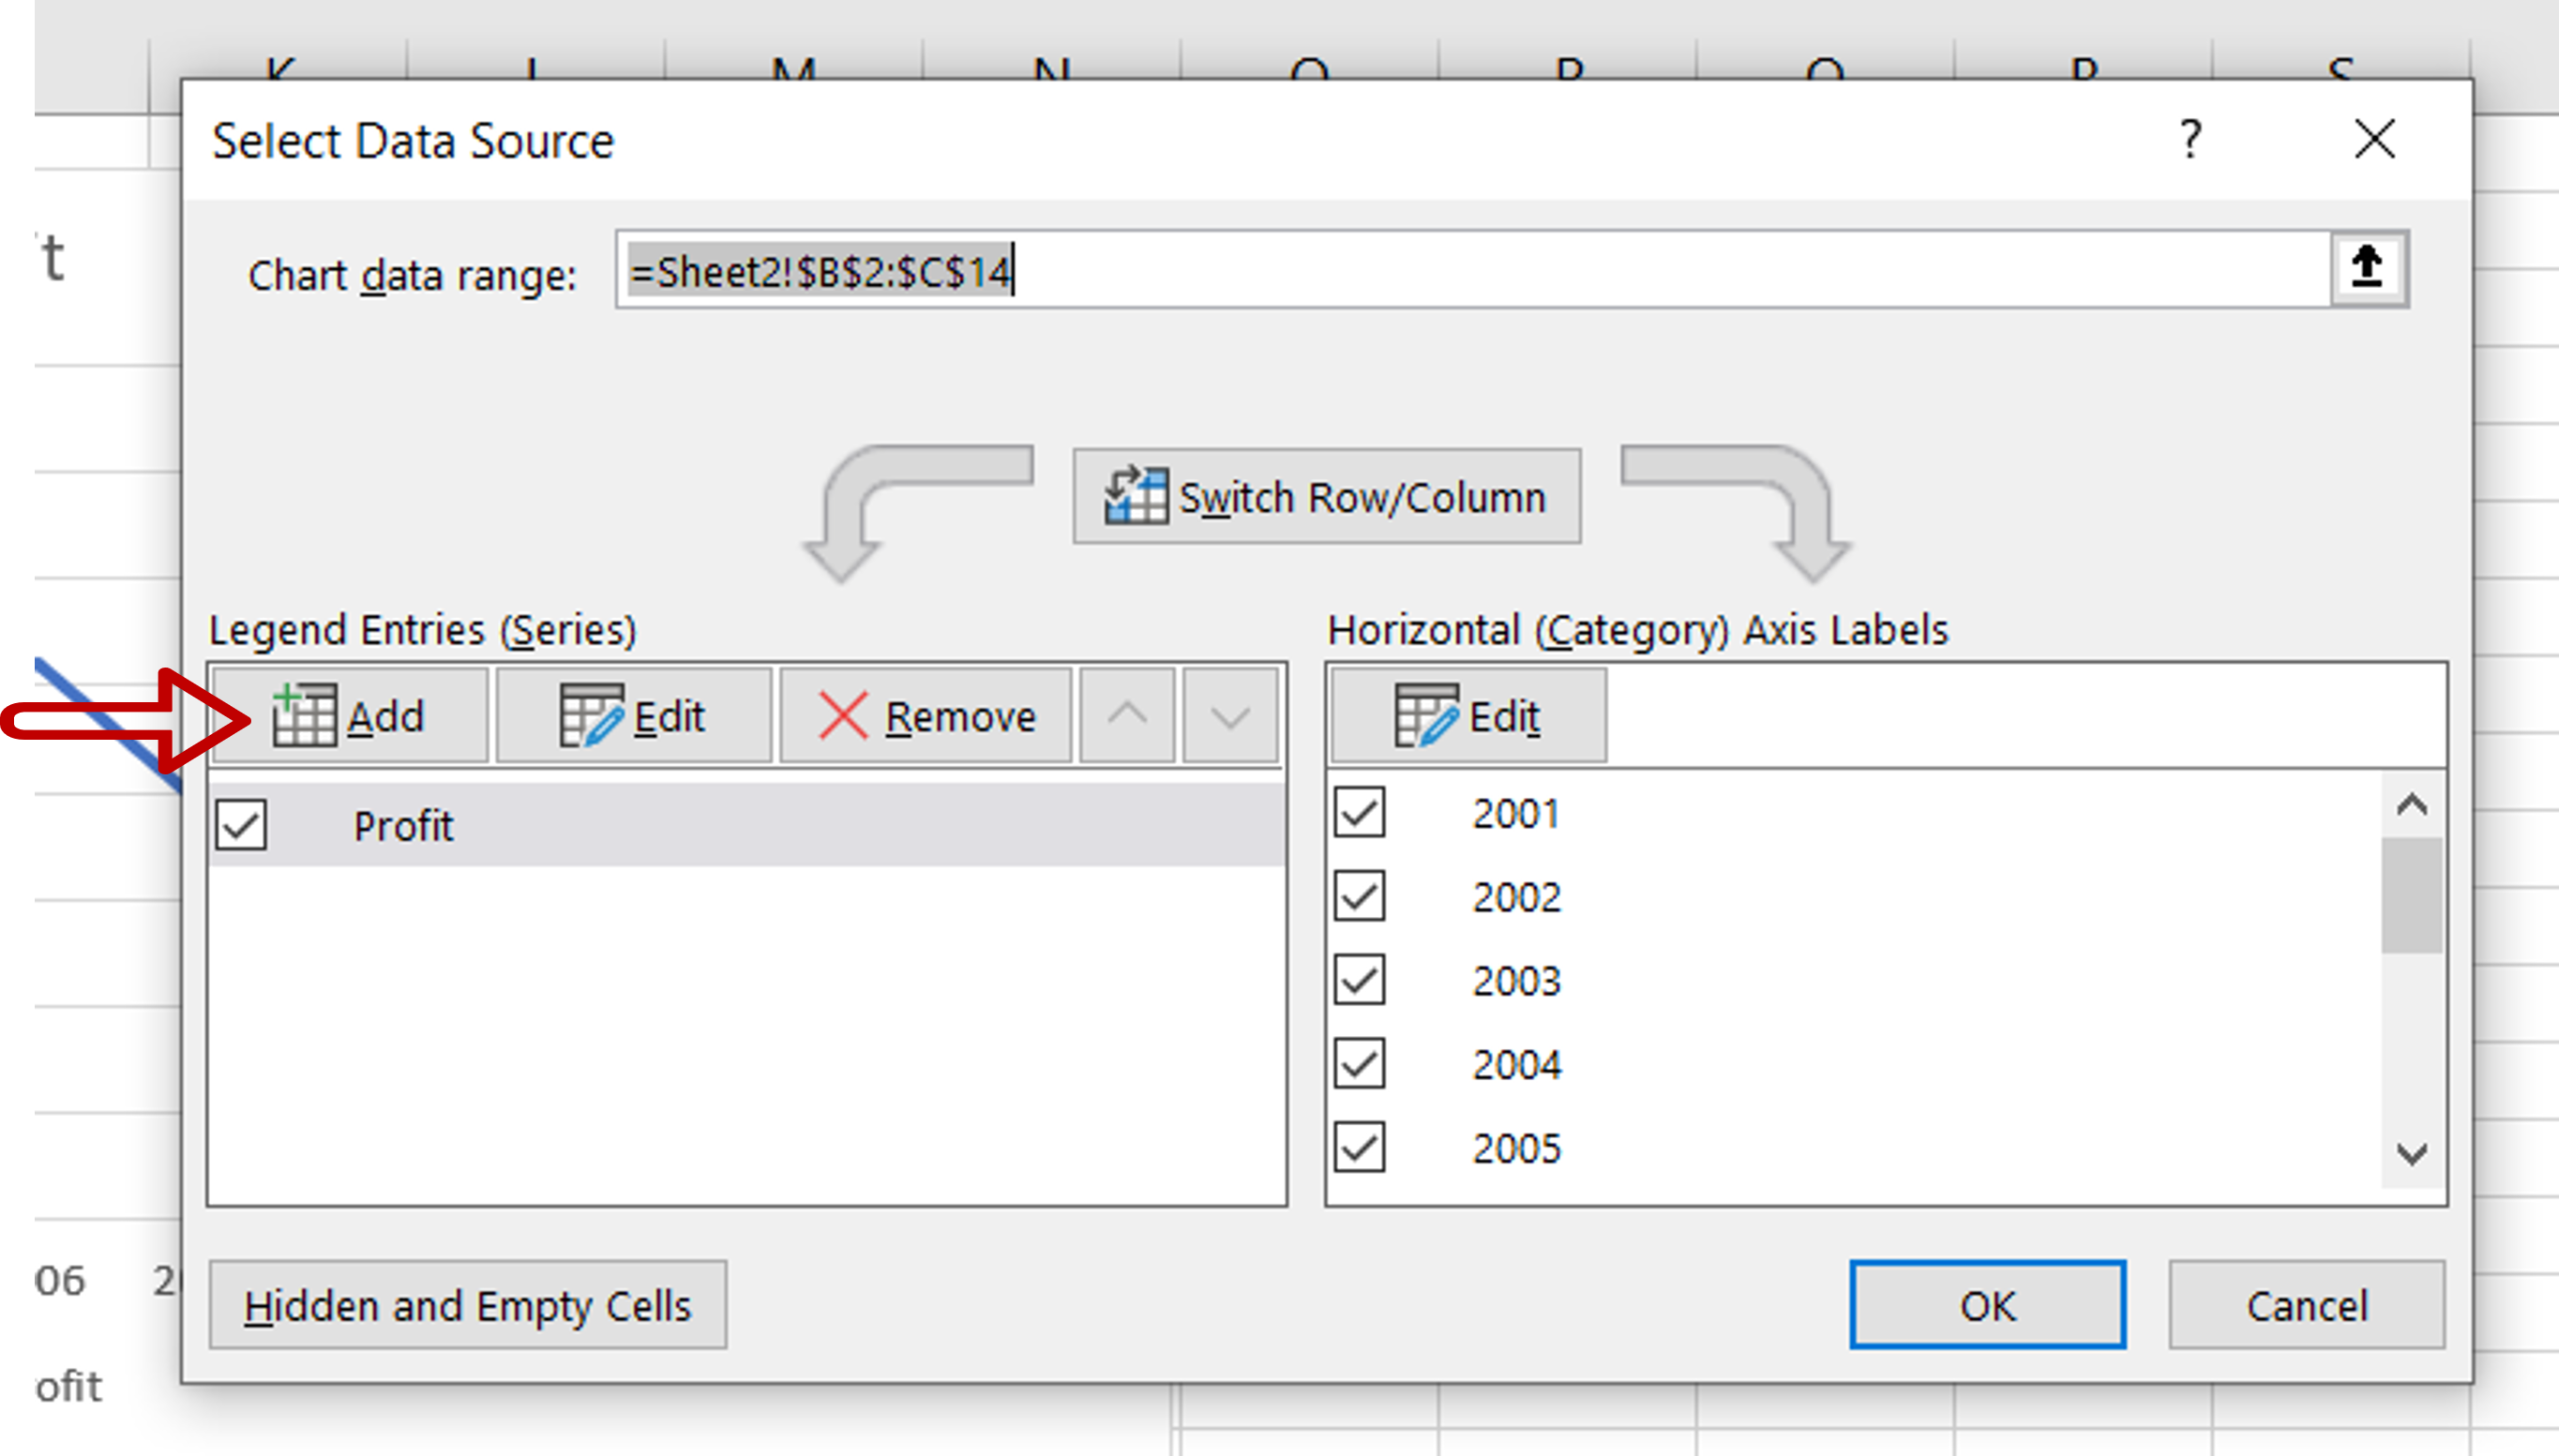
– Under Legend Entries (Series) click Add
Step 3 – Enter the values for the Series
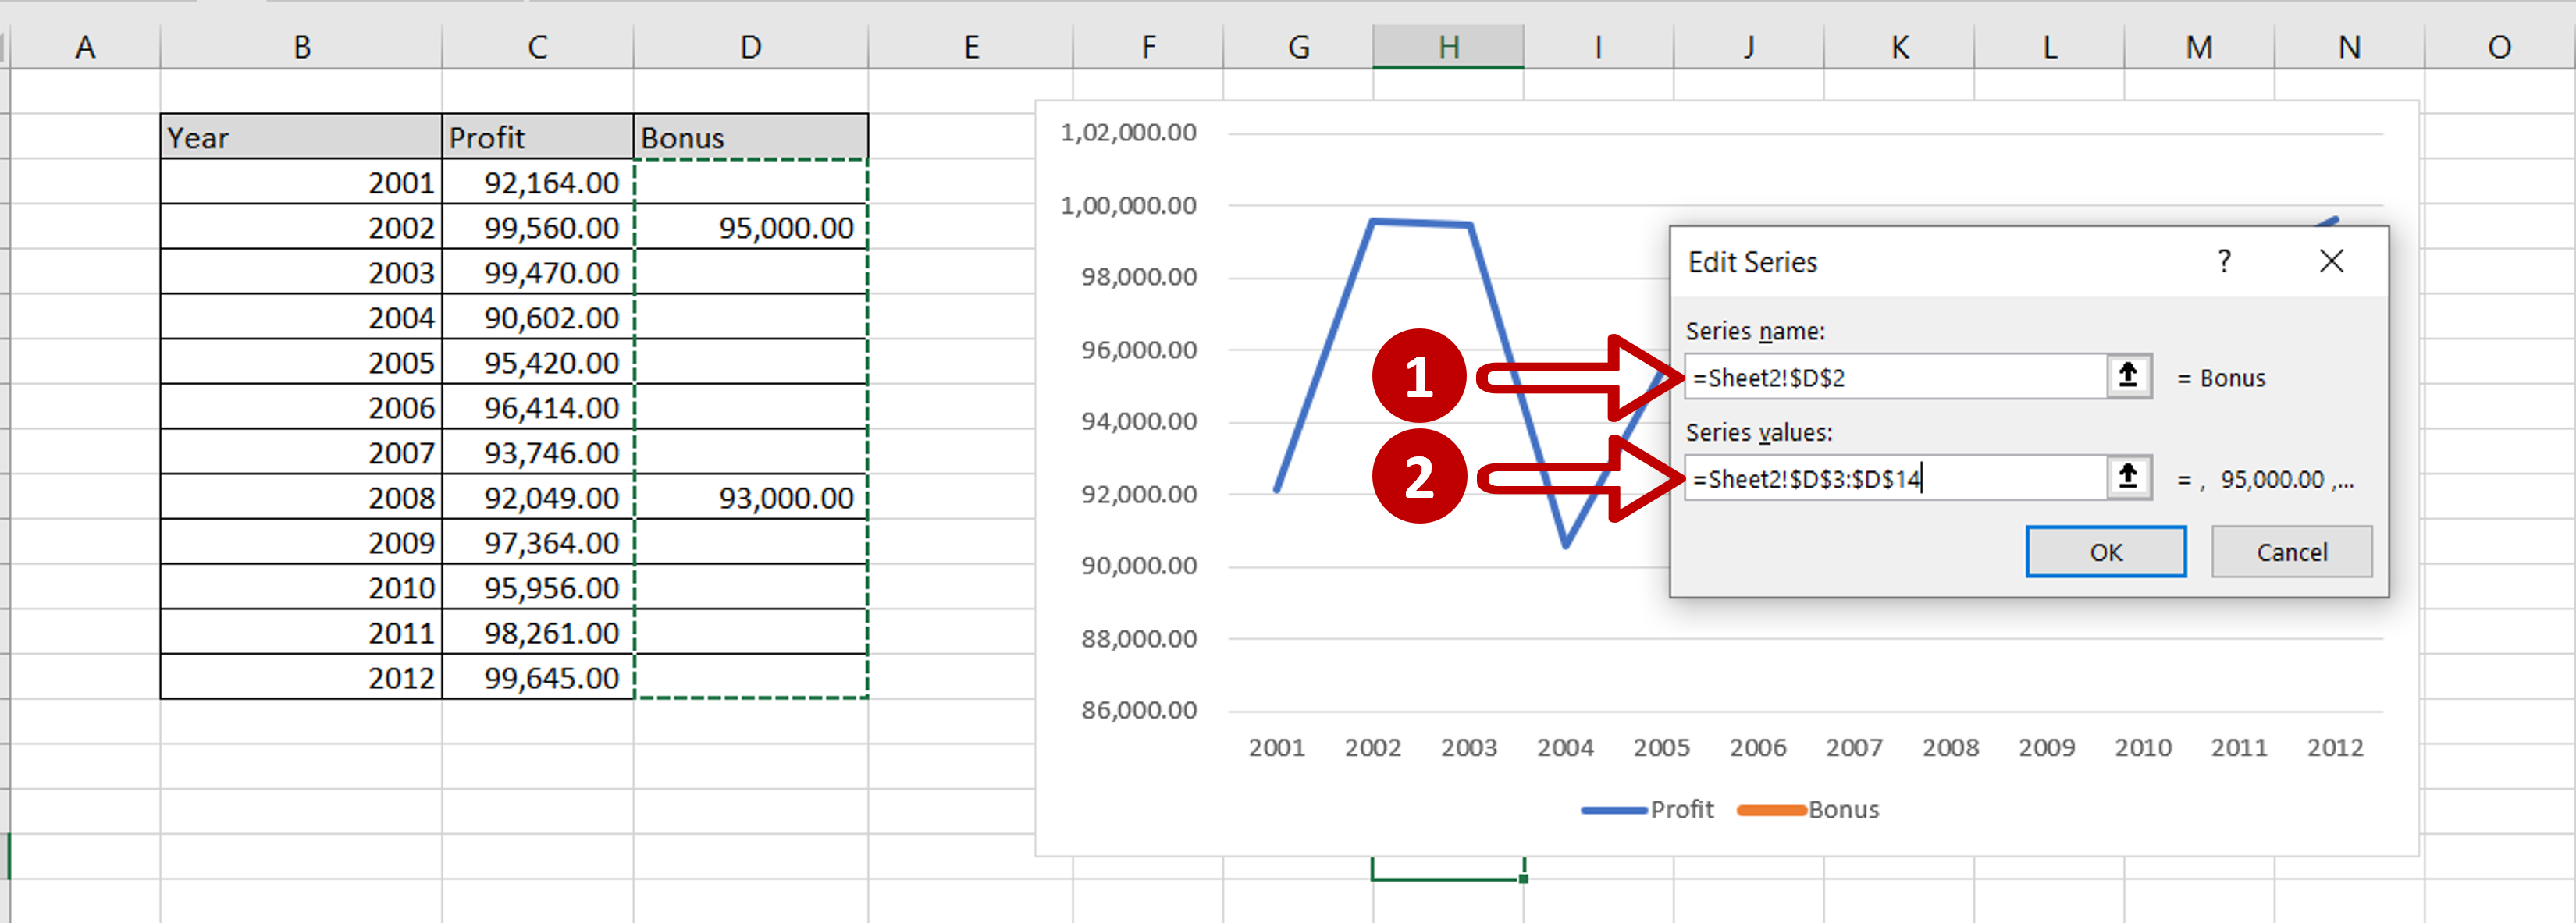
– Select the ‘Bonus’ column header for the Series name
– Select the range of the ‘Bonus’ column for the Series values in either of the following ways:
– Click on the first cell of the column, hold down the left-click button on the mouse, and drag to the end of the column
– Select the first cell of the column, hold down the Shift key and press the down arrow key till the last cell of the column is selected
– Click OK to close the Edit Series box
Step 4 – Close the Select Data Source box
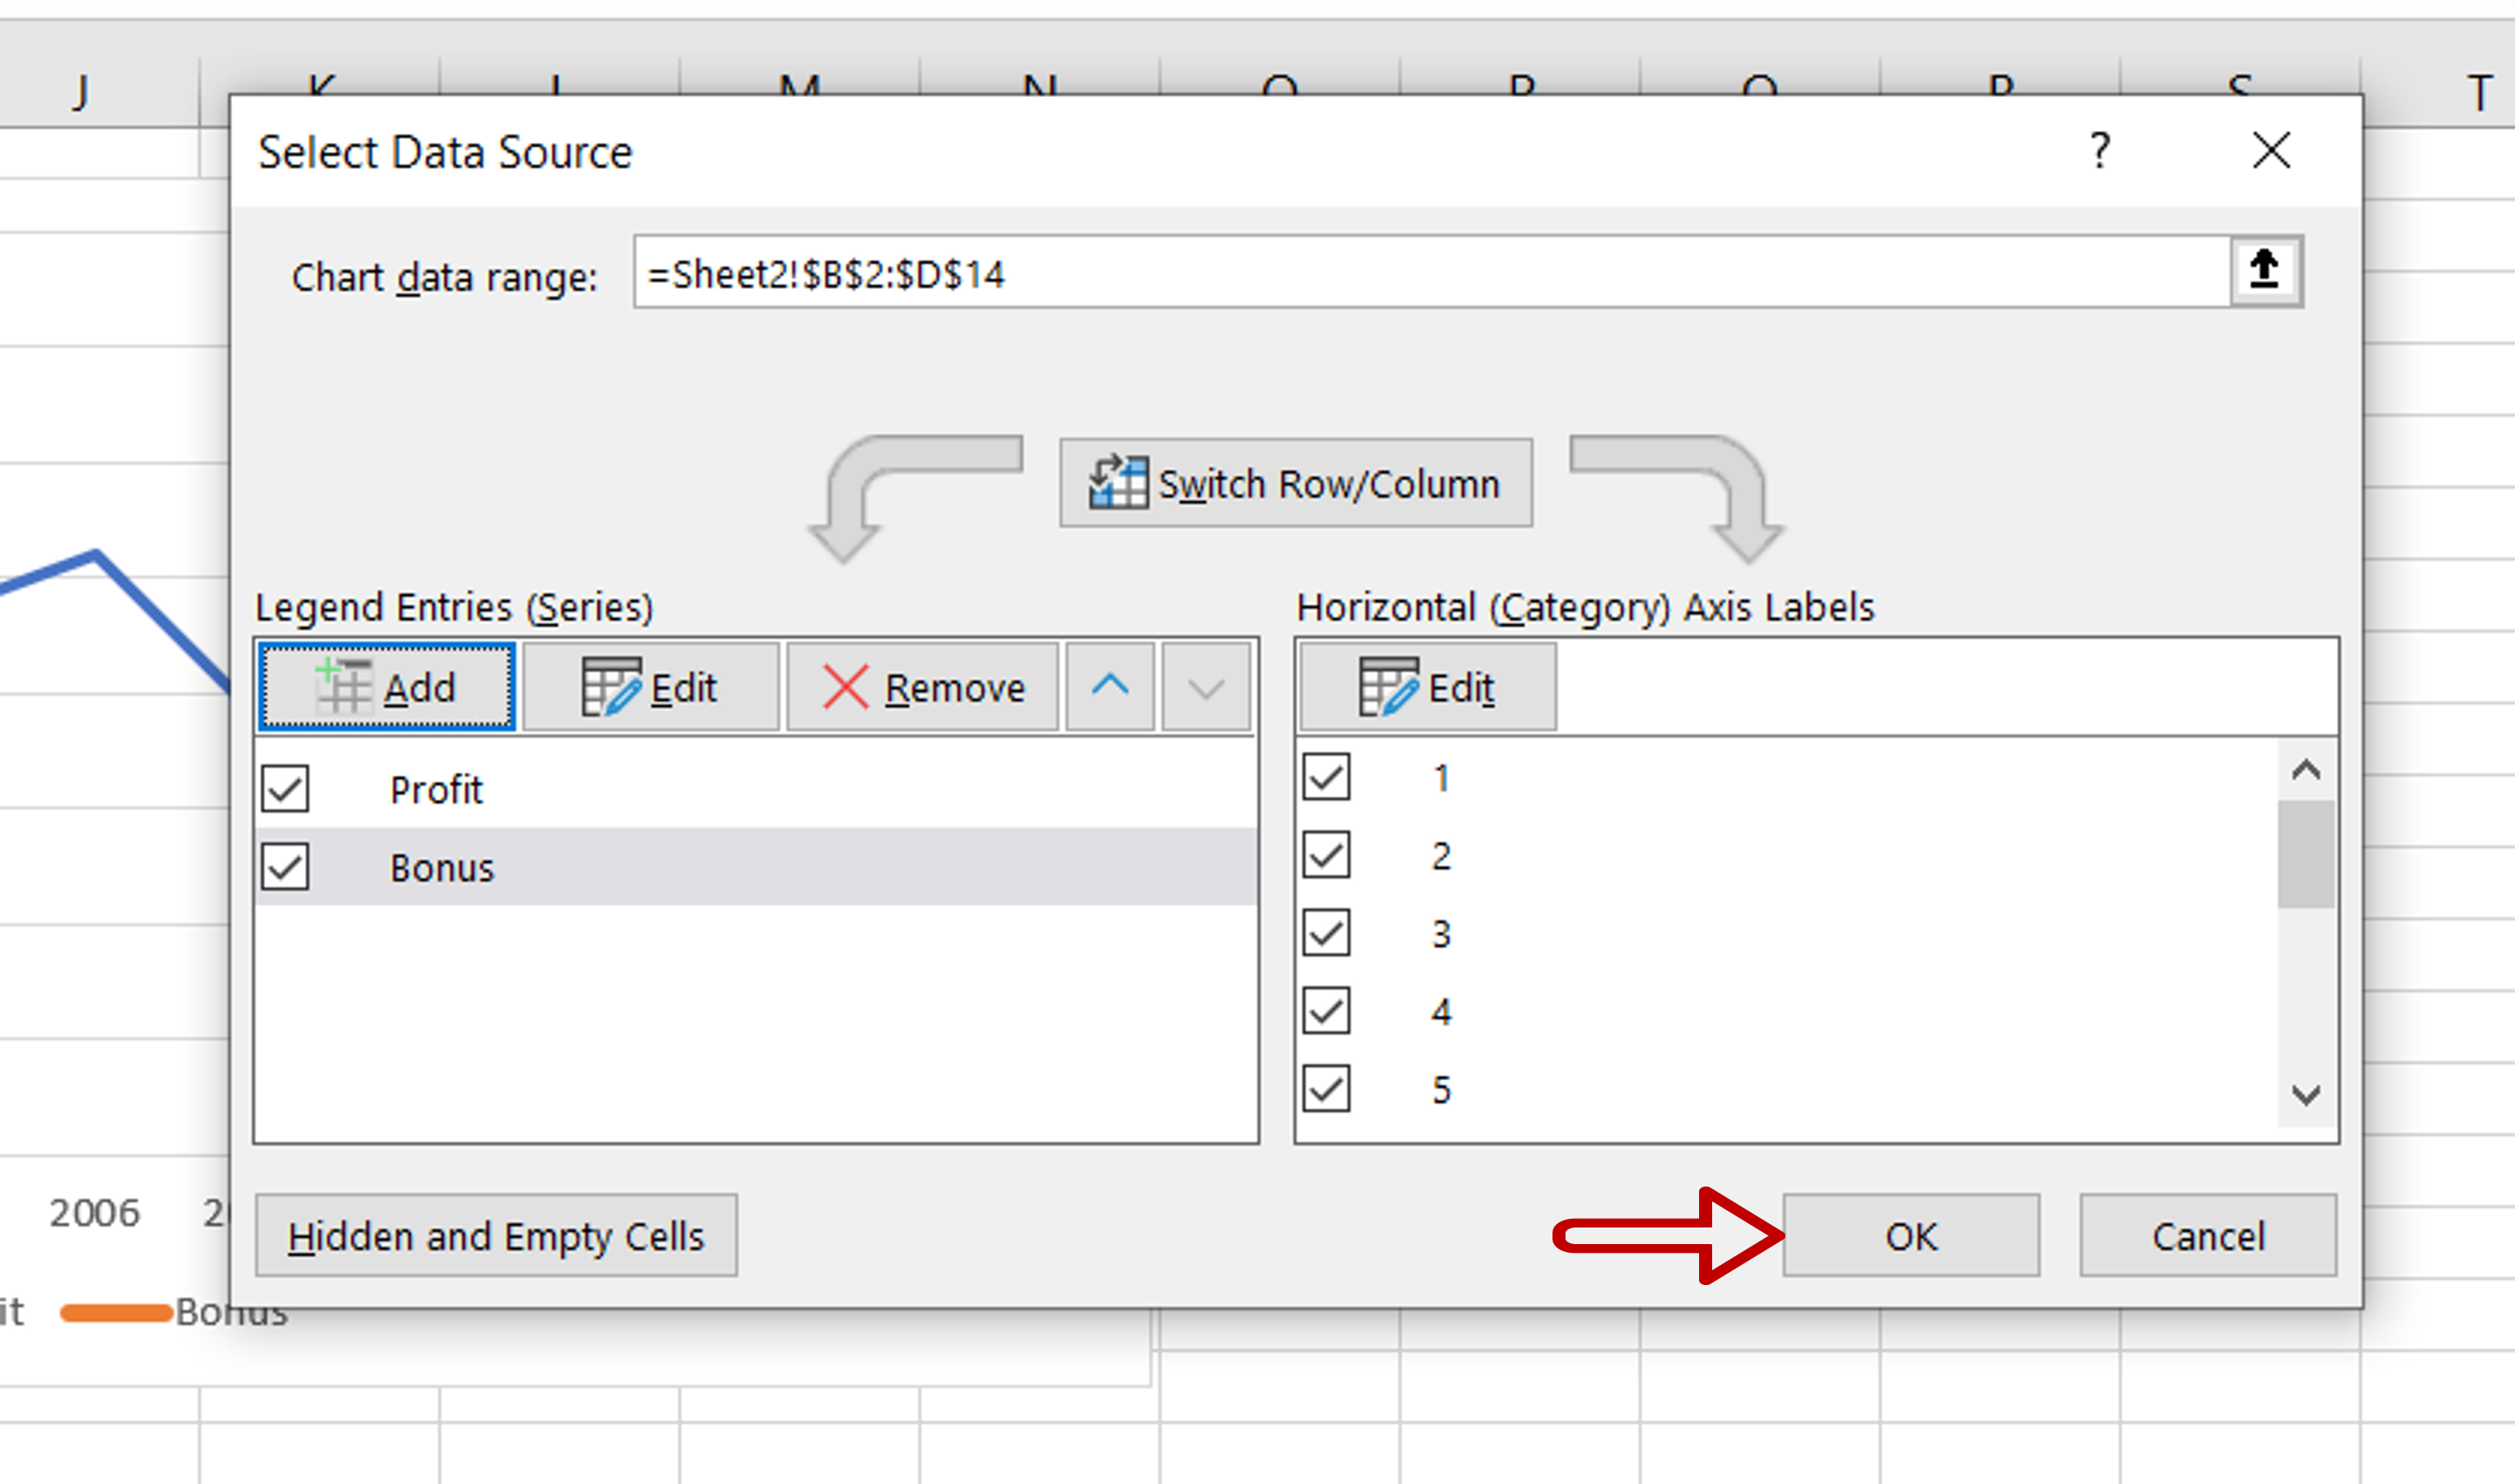
– Click OK again to close the Select Data Source box
Step 5 – Open the Change Chart Type box
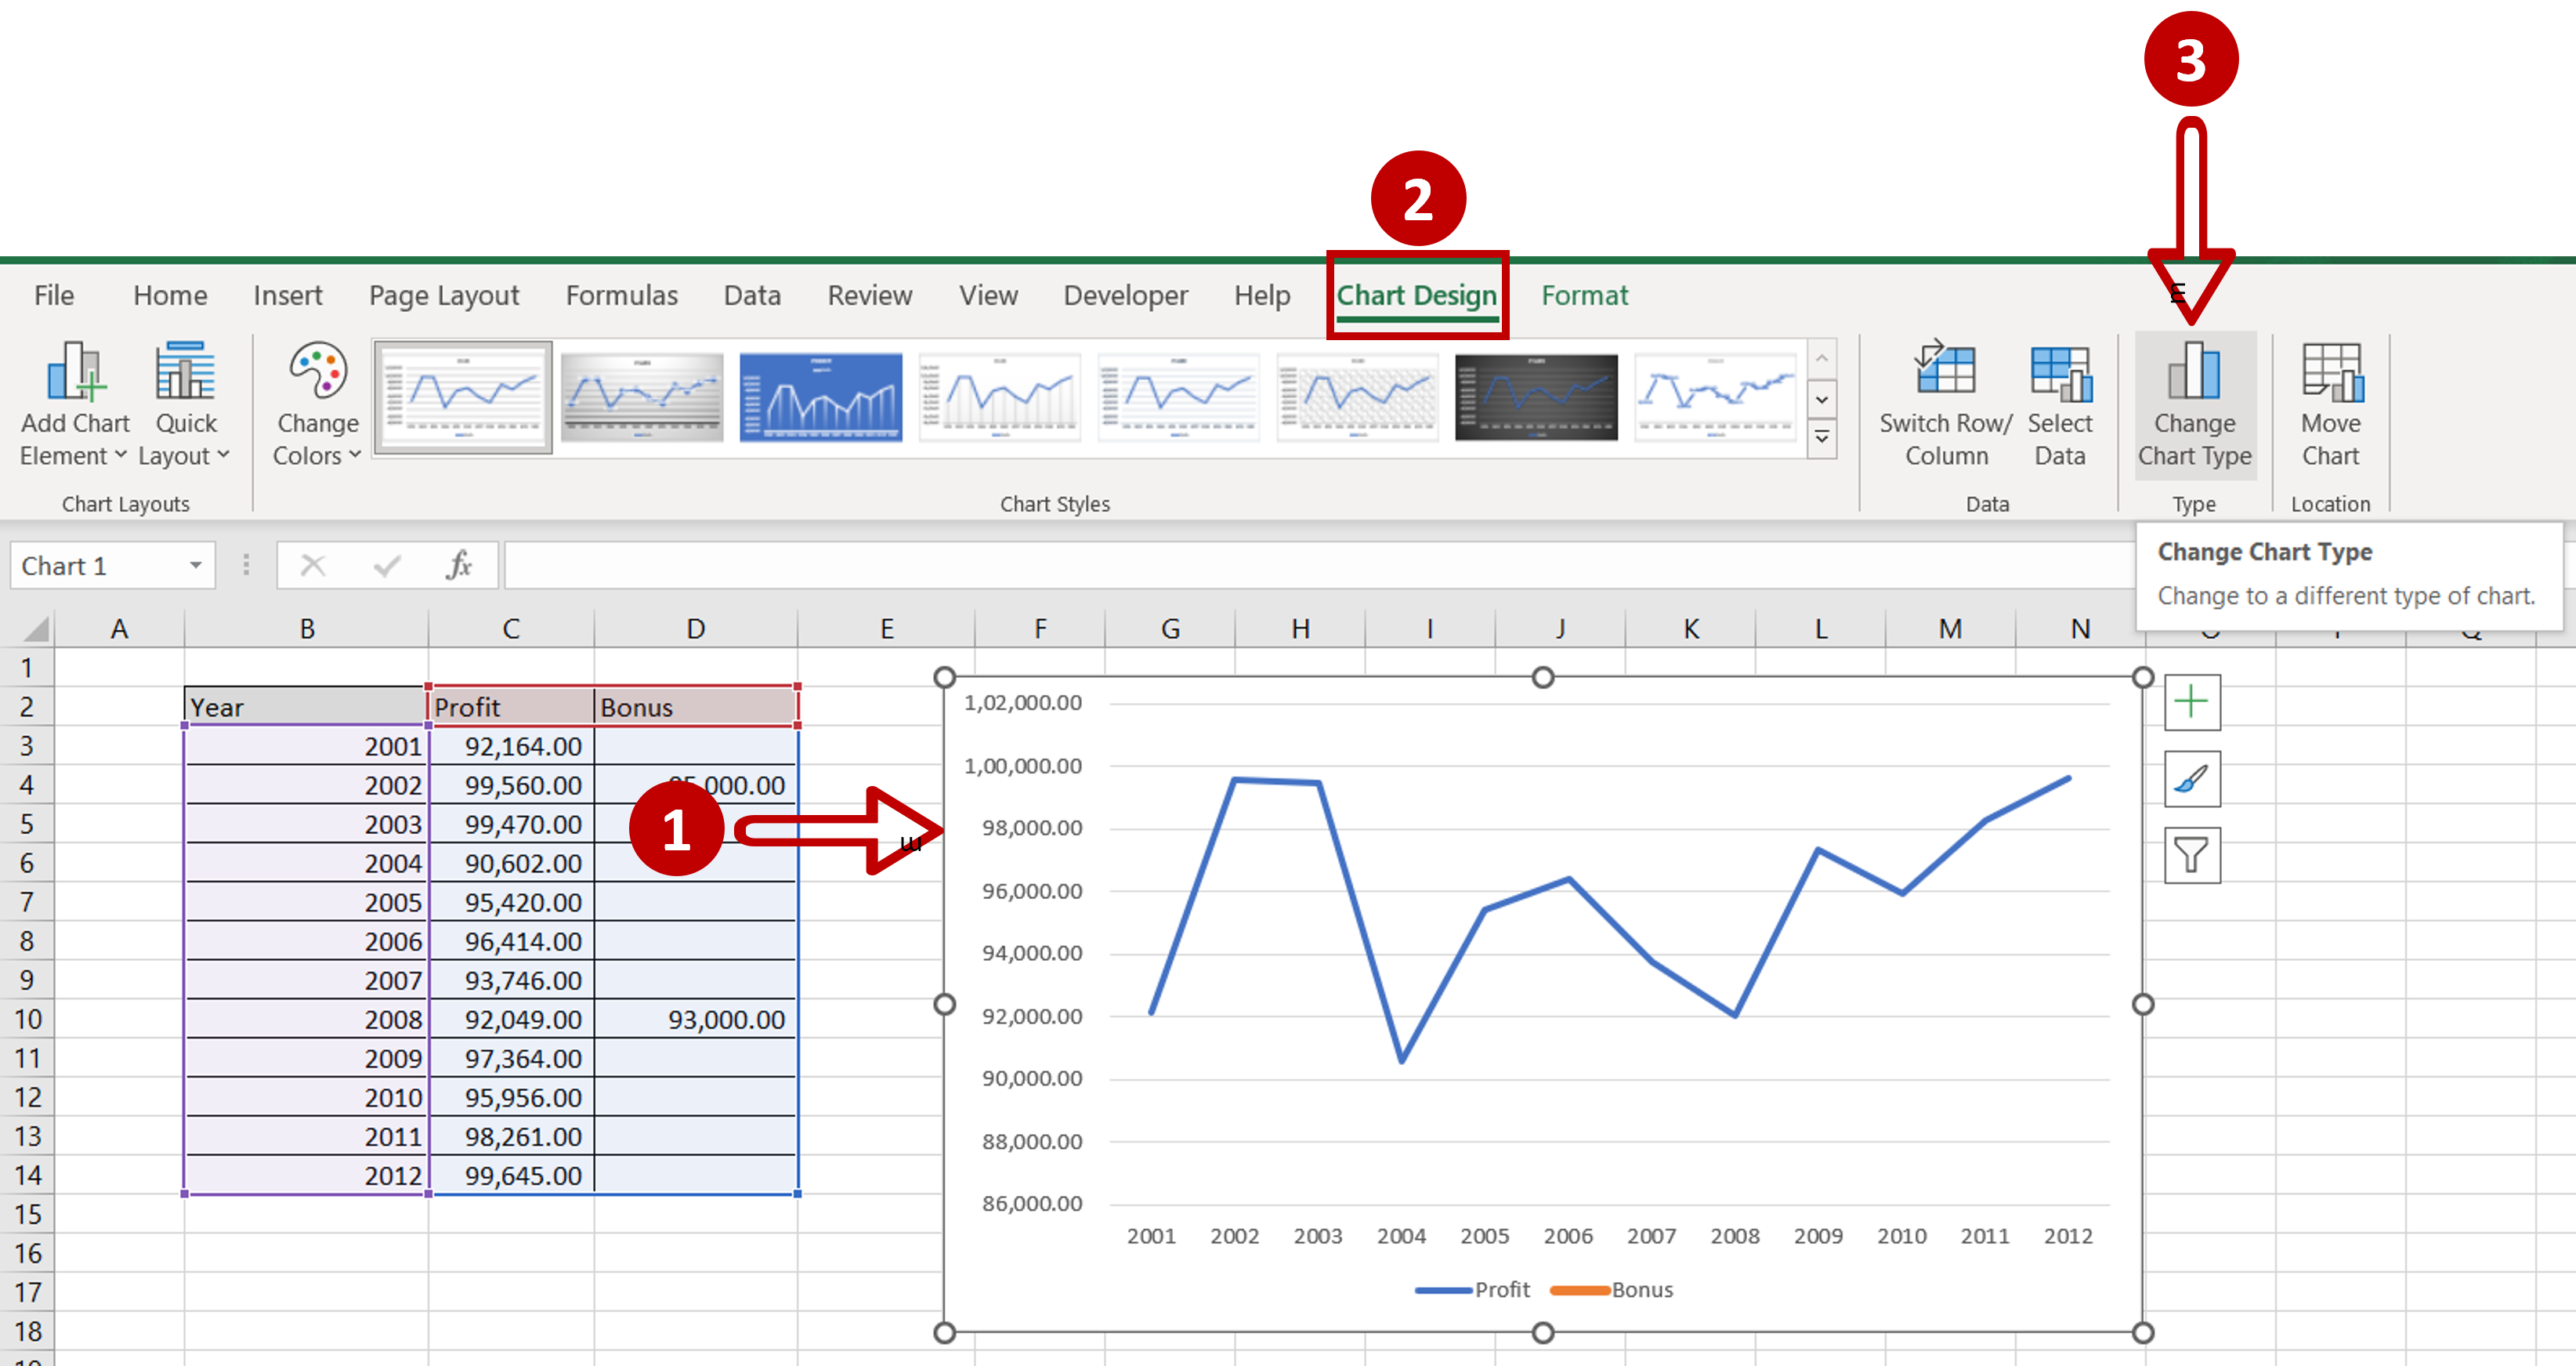
– Select the chart to summon the Chart Design menu
– Go to Type and click on the Change Chart Type button
OR
– Right-click and select Change Chart Type from the context menu
Step 6 – Choose the Line with Markers type
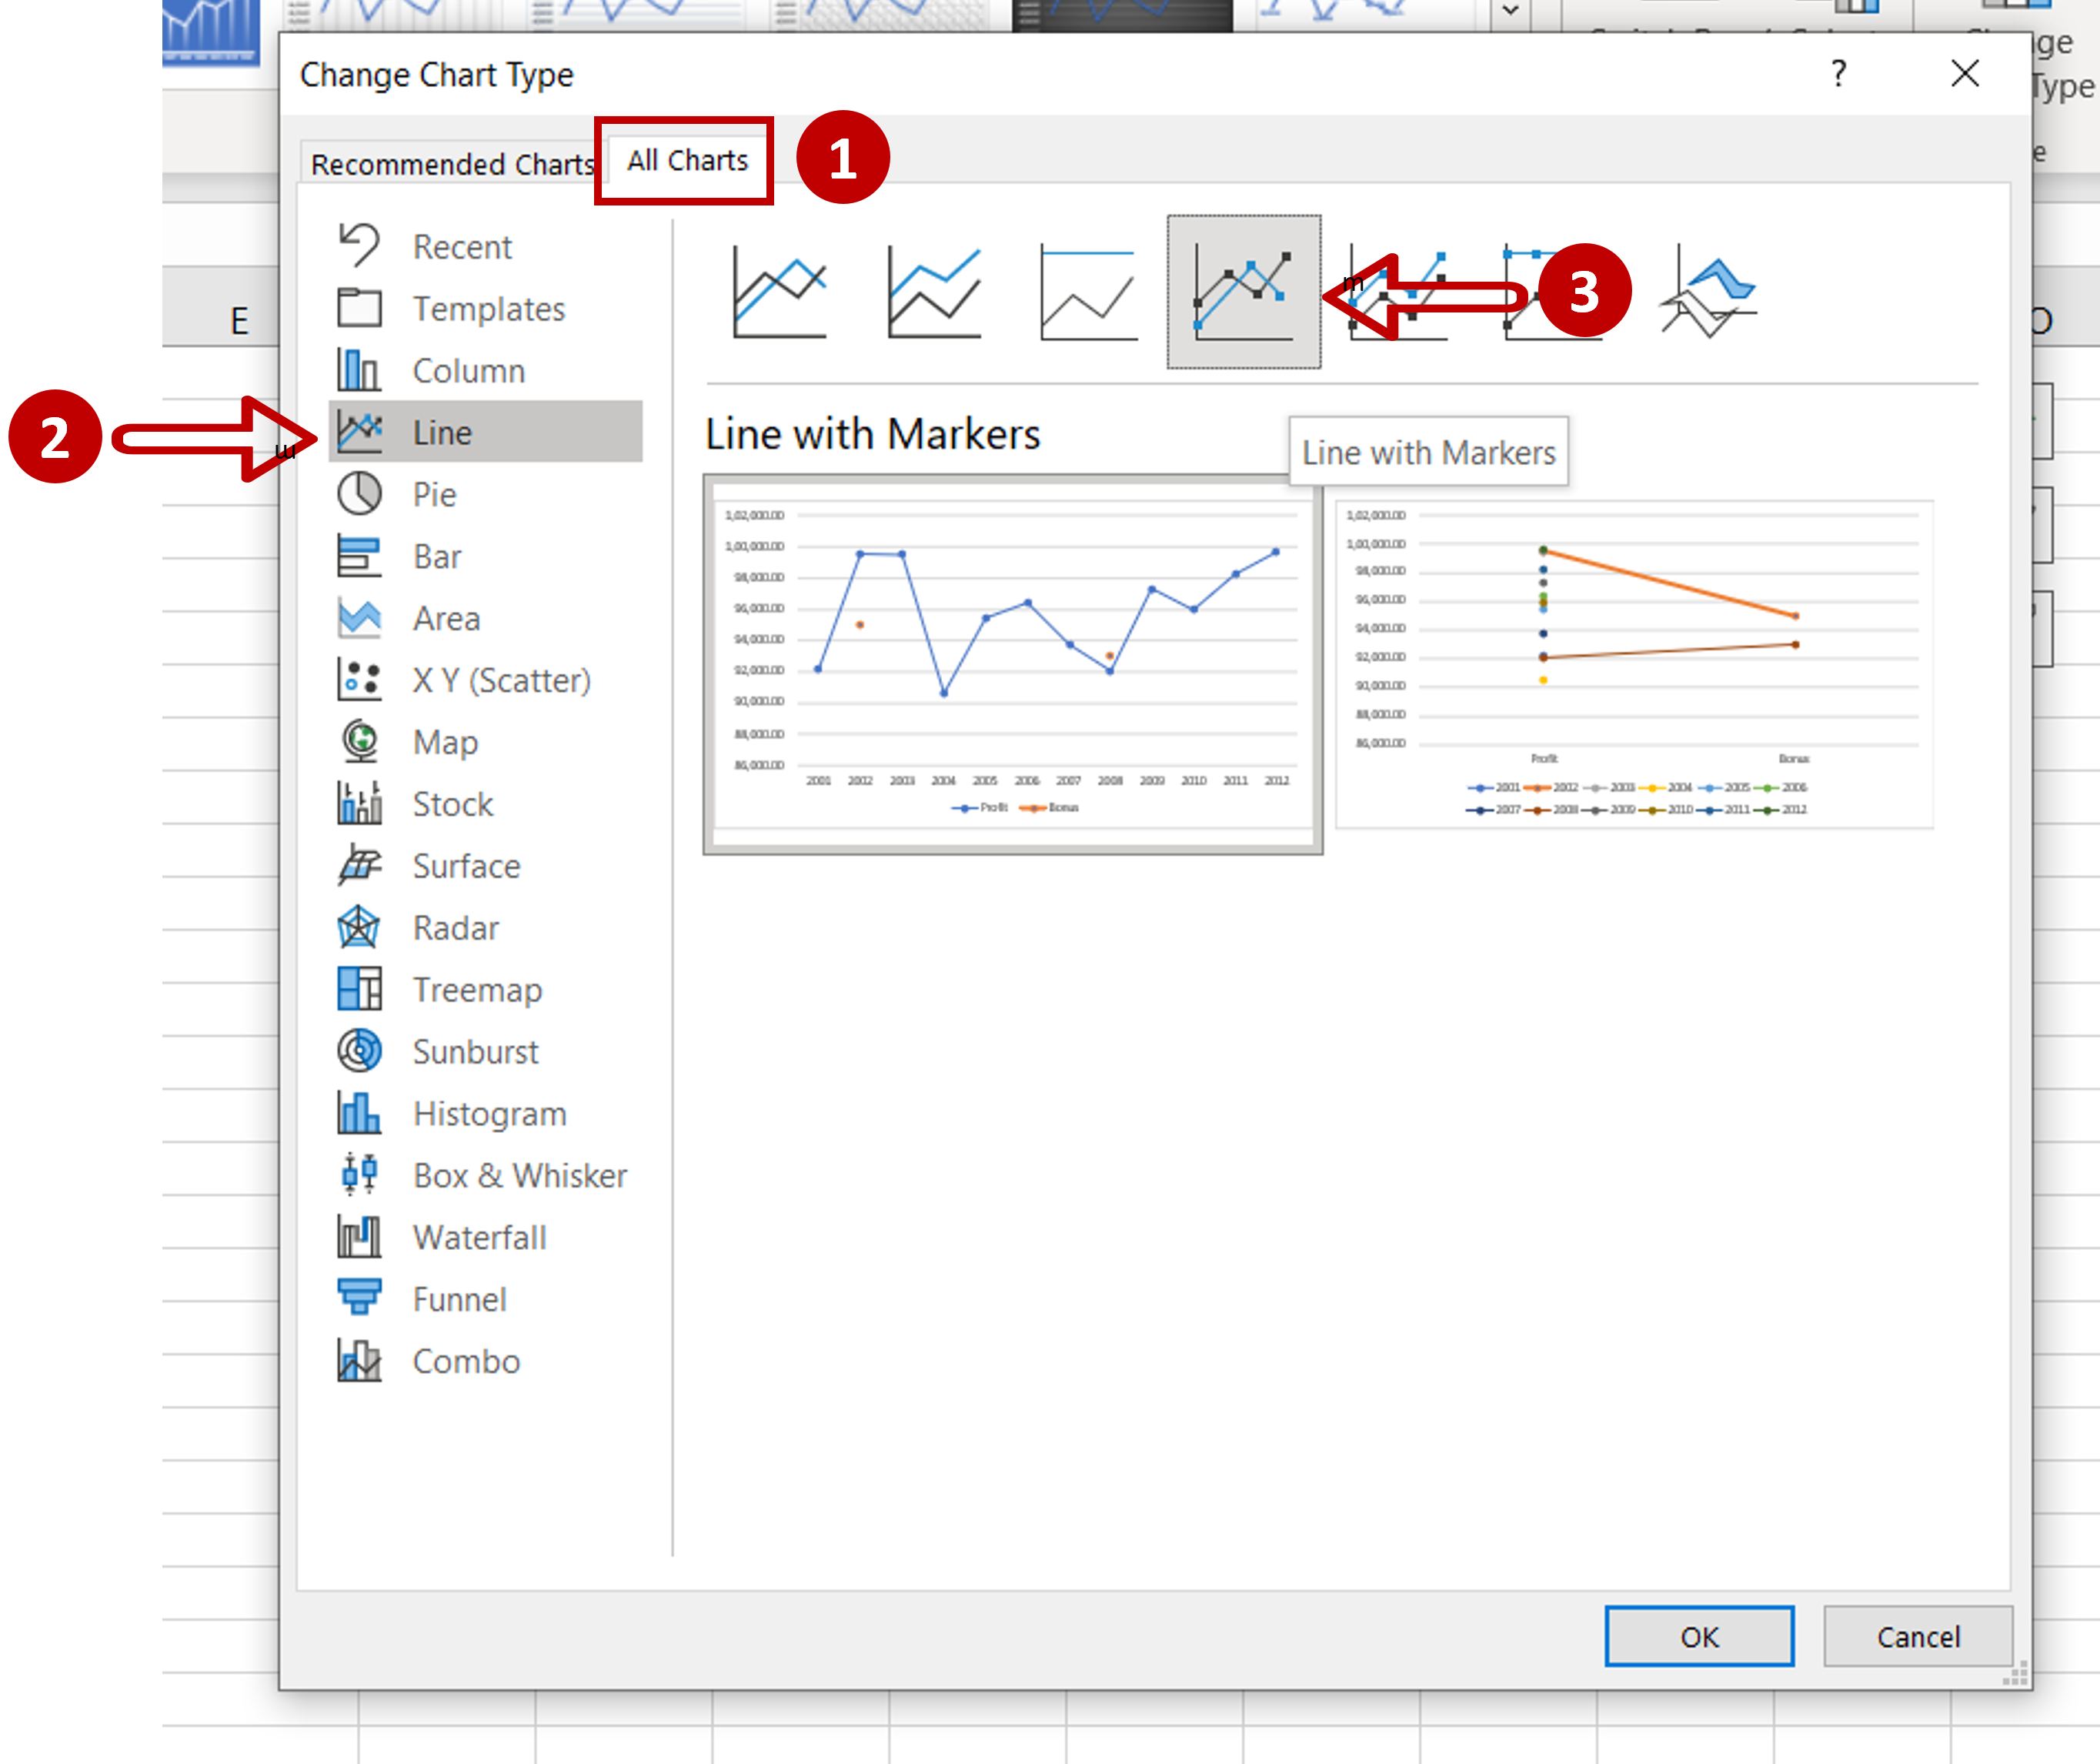
– Go to the All Charts tab
– Under Line, choose the Line with Markers option
– Click OK
Step 7 – Check the result
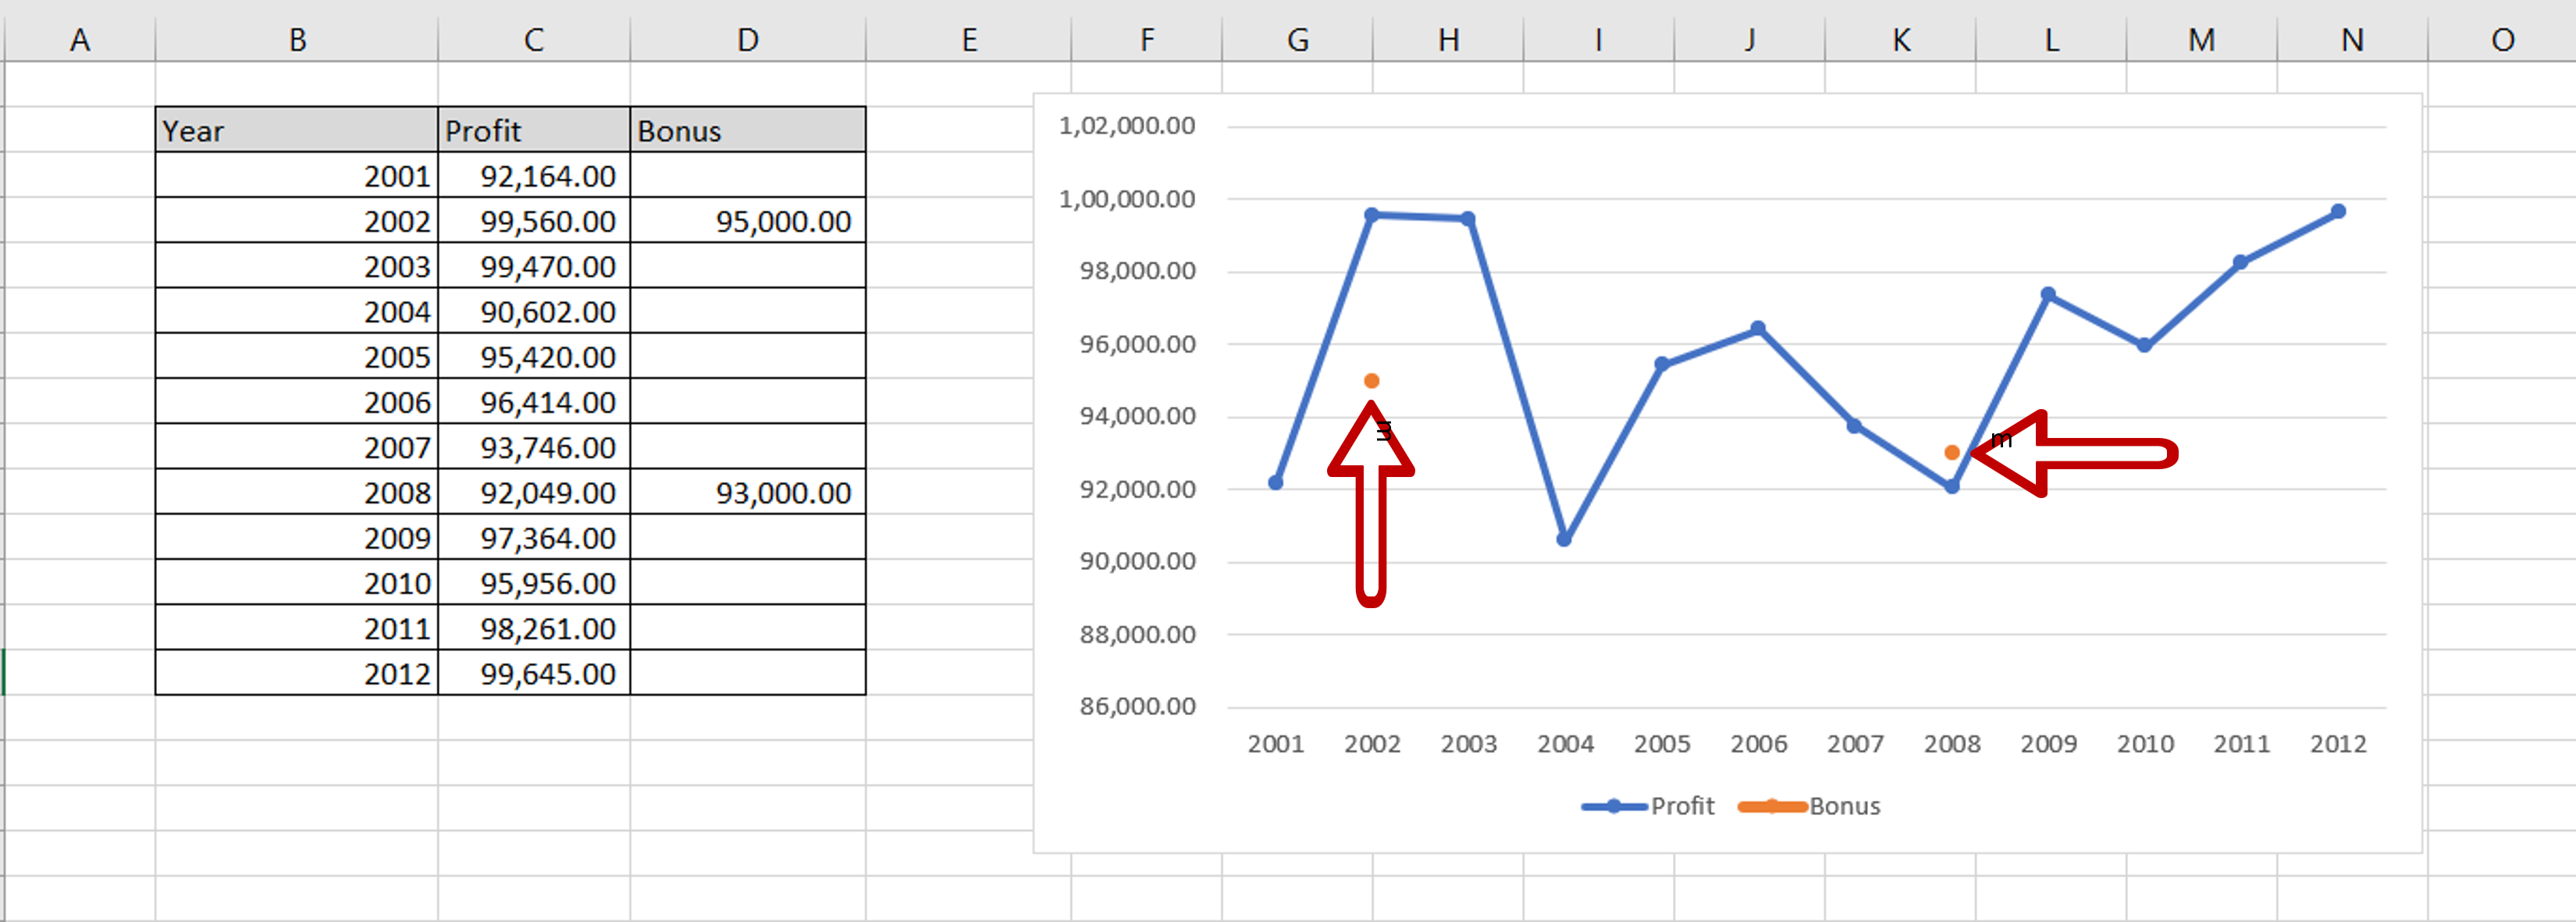
– The ‘Bonus’ figures are displayed as data points for the corresponding years


