
How to add Custom Error Bar to the Charts
 By
SpreadCheaters
By
SpreadCheaters
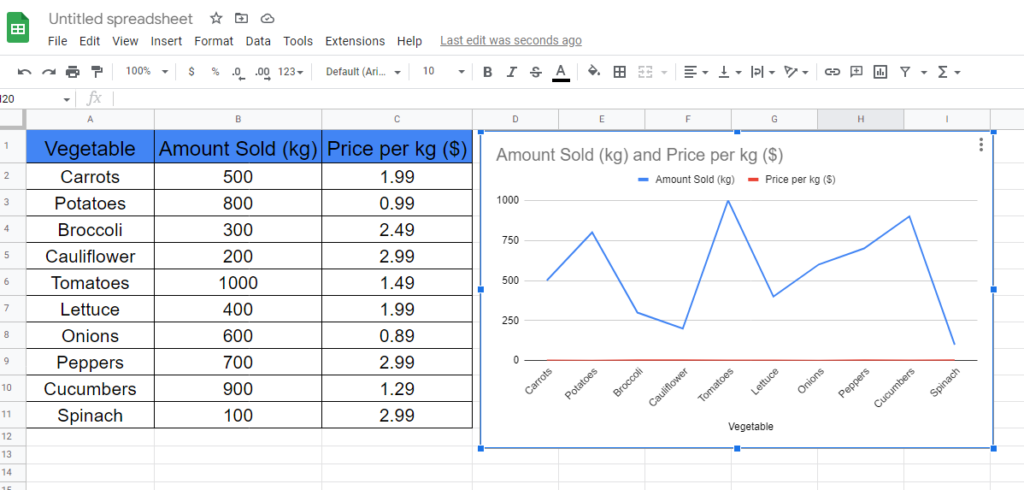
Here we have a dataset which contains the name of Vegetables, Amount Sold (kg) and Price per Kg ($). We also have its visual representation in the form of a chart. We will be adding some error bars to this chart by following the steps below but first let’s have a look at the dataset above.

Google Sheets is a powerful tool that can be used for data analysis and visualization. One useful feature of Google Sheets is the ability to add custom error bars to charts. Error bars can help visualize the variability of data and provide more information about the data set. In this tutorial, we will walk through the steps to add custom error bars to a chart in Google Sheets.
Step 1 – Open Chart Editor
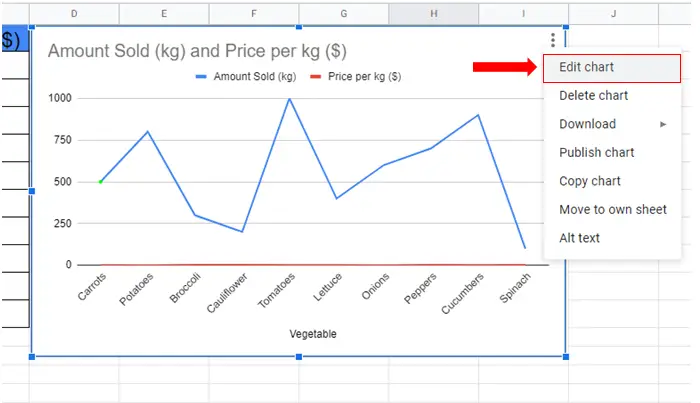
– To add Error Bars to the chart first open Chart Editor.
– To open Chart Editor, click on the Chart then click on the three dots at top right of the chart.
– Select Edit Chart.
Step 2 – Add Error Bars
– After opening Chart Editor, click on the Customize tab.
– Open drop-down menu of Series.
– Scroll down in Series and you will find the Error Bar check box.
– Check the Error Bar box and then choose the Type of Error bar and type the Value you want.


