
How many sizing handles does a selected chart object have and how to use it to resize?
 By
SpreadCheaters
By
SpreadCheaters
Sizing handles are a useful feature in Excel that allow you to adjust the size of objects, such as charts, pictures, or shapes, to fit your specific needs. Here are some common ways in which sizing handles are used in Excel:
Resizing charts: When working with charts in Excel, sizing handles are used to adjust the size of the chart to fit your data or presentation needs.
Resizing pictures: Sizing handles are also commonly used when working with pictures in Excel. By using the handles to adjust the size of the picture, you can make it fit better within a specific cell or range of cells.
Resizing shapes: Shapes are another object in Excel that can be resized using sizing handles.
Maintaining proportions: When resizing objects in Excel, sizing handles help to maintain the proportions of the object. This ensures that the object does not become distorted or skewed when you adjust its size.
How many sizing handles exist for a chart object?
Most objects in Excel will have either four or eight sizing handles, depending on the type of object and the version of Excel you are using.
- A chart object in Excel has eight sizing handles: one at each corner and one in the middle of each side. These handles allow you to resize the chart horizontally, vertically, or diagonally.
- On the other hand, a picture object in Excel has only four sizing handles: one at each corner. These handles allow you to resize the picture horizontally, vertically, or diagonally.
- Similarly, a shape object in Excel also has four sizing handles: one at each corner. These handles allow you to resize the shape horizontally, vertically, or diagonally.
Identify the Sizing Handles
Sizing handles in Excel are small squares or circles that appear around the perimeter of an object when it is selected. The appearance of the sizing handles may vary slightly depending on the version of Excel you are using.
Let’s follow the steps mentioned below to see how to enable these handles on the chart object and then use them to resize the chart object as well.
In Excel, a sizing handle is a small square or circle that appears around the edges of a selected object, such as a chart, picture, or shape.
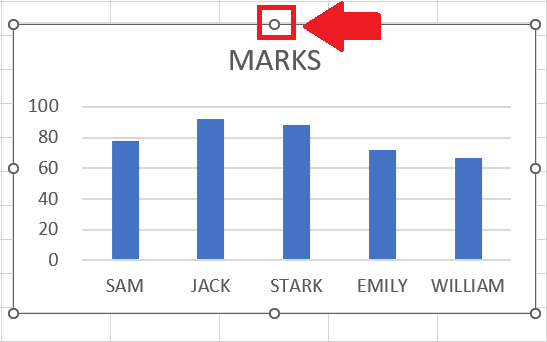
Step 1 – Enable Sizing Handles
– Select the object that you want to resize. This could be a chart, picture, or shape. In our case, it will be a chart object.
– Once the chart object is selected, sizing handles will automatically appear around the perimeter of the object as shown above.
Step 2 – Using Sizing Handles to resize the chart object
– To resize an object using sizing handles, simply click and drag one of the handles in the direction you want to resize the object.
– This will increase or decrease the size of the chart object depending upon the way you drag the sizing handles.
– If you drag the sizing handles inwards to the chart, it will decrease the size of the chart object.
– If you drag the sizing handles outwards from the chart then it will increase the size of the chart object as shown in the image.


