
How to create an organizational chart in Excel
 By
SpreadCheaters
By
SpreadCheaters

There are a number of tools that are common across Microsoft Office applications and the SmartArt suite is one of them. You may need to use an organization chart when you are working in Excel. For example, if you are preparing a report related to Human Resources, you may want to include a chart depicting the team structure.
Step 1 – Open the Choose a SmartArt graphic dialog box
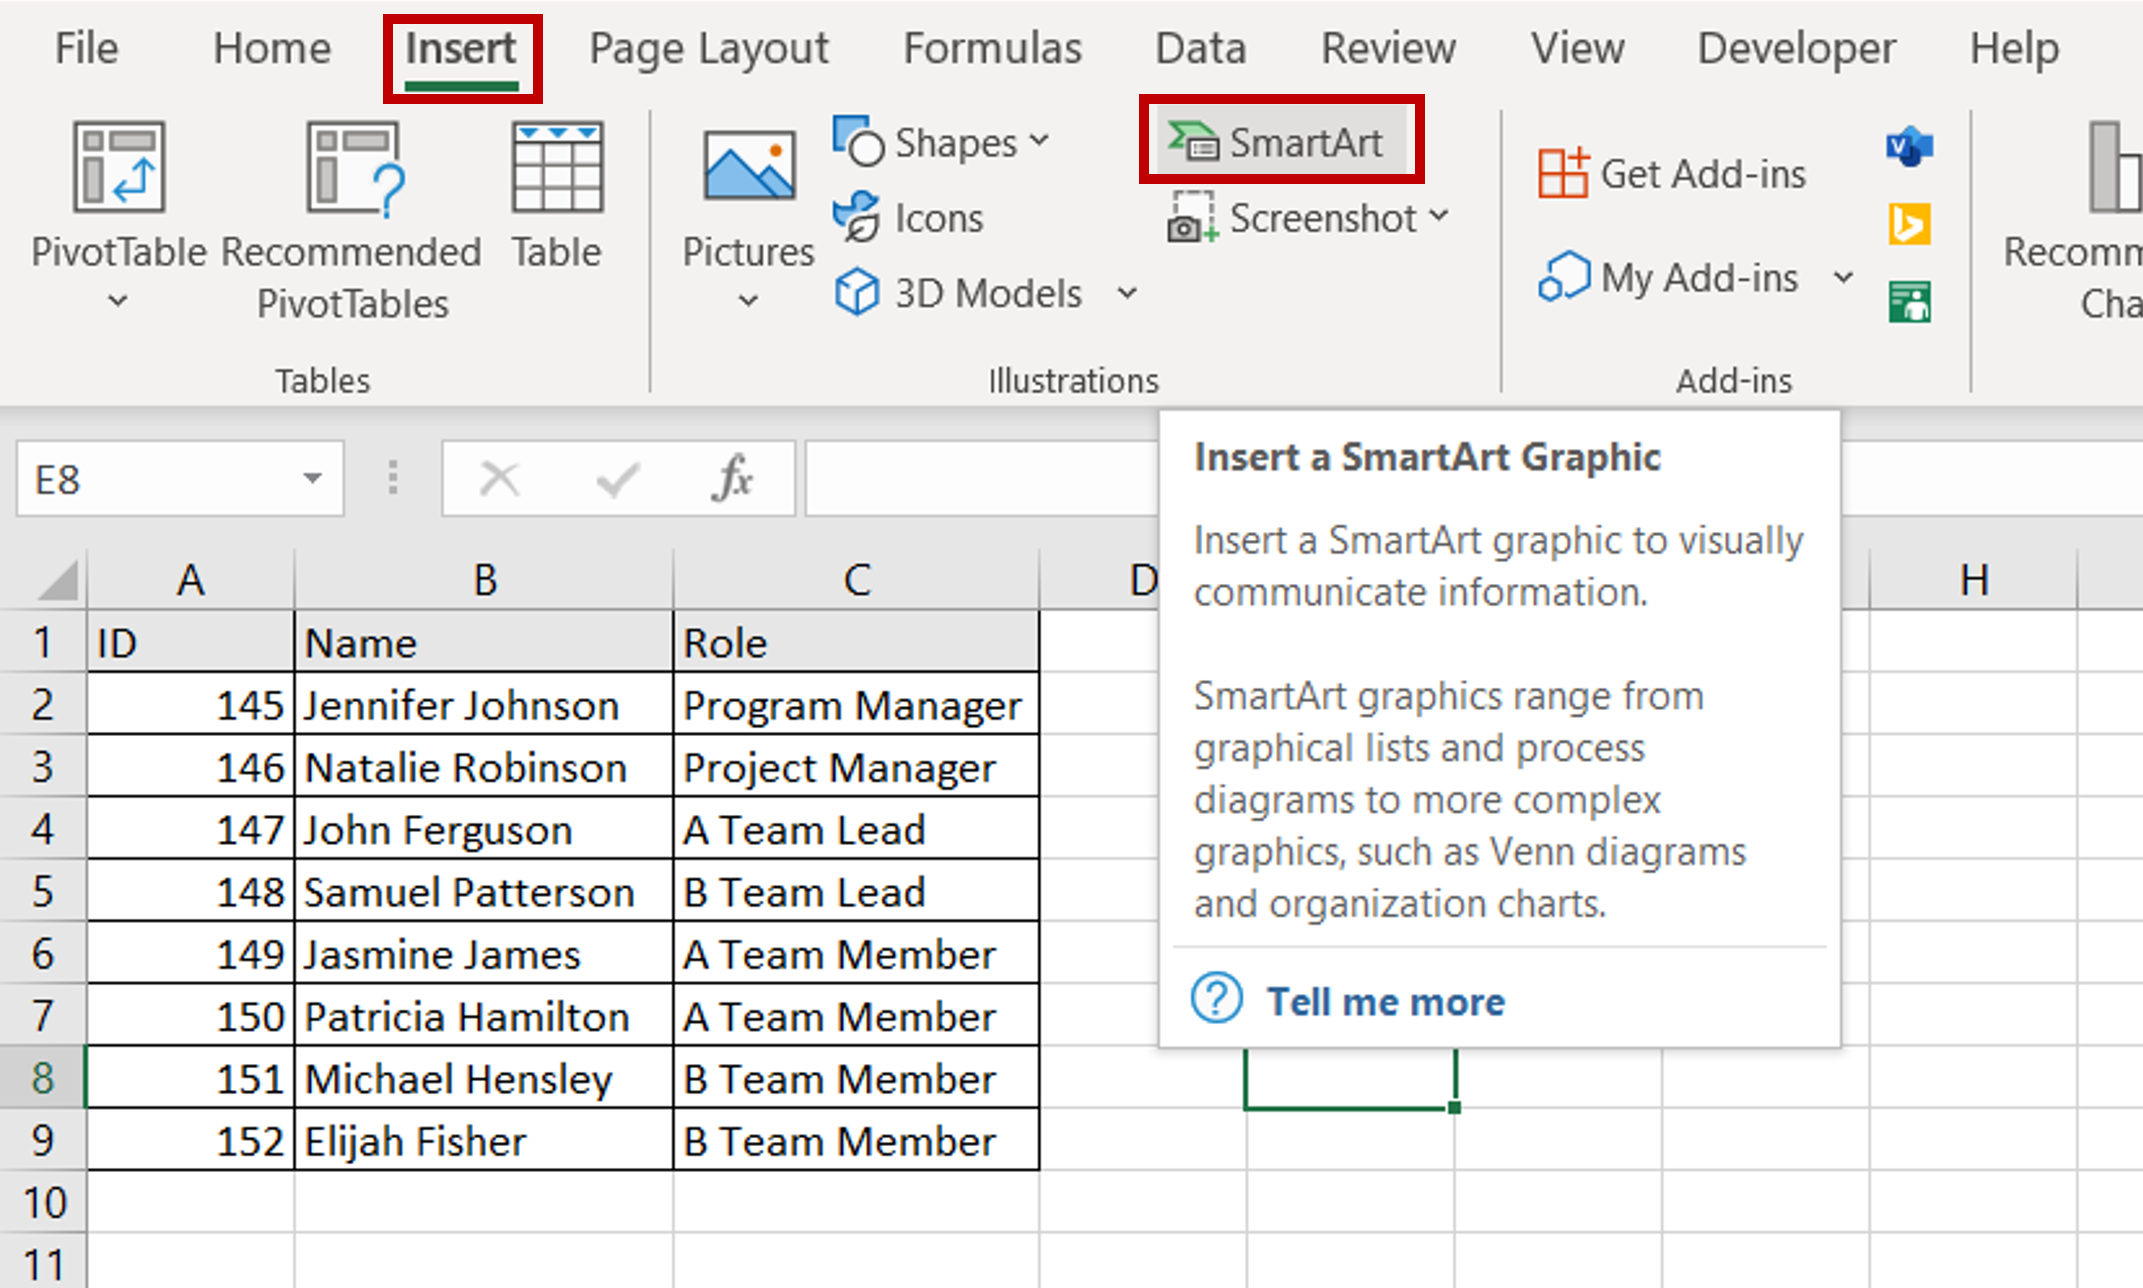
– Go to Insert > Illustrations
– Click the SmartArt button
Step 2 – Select an organization chart
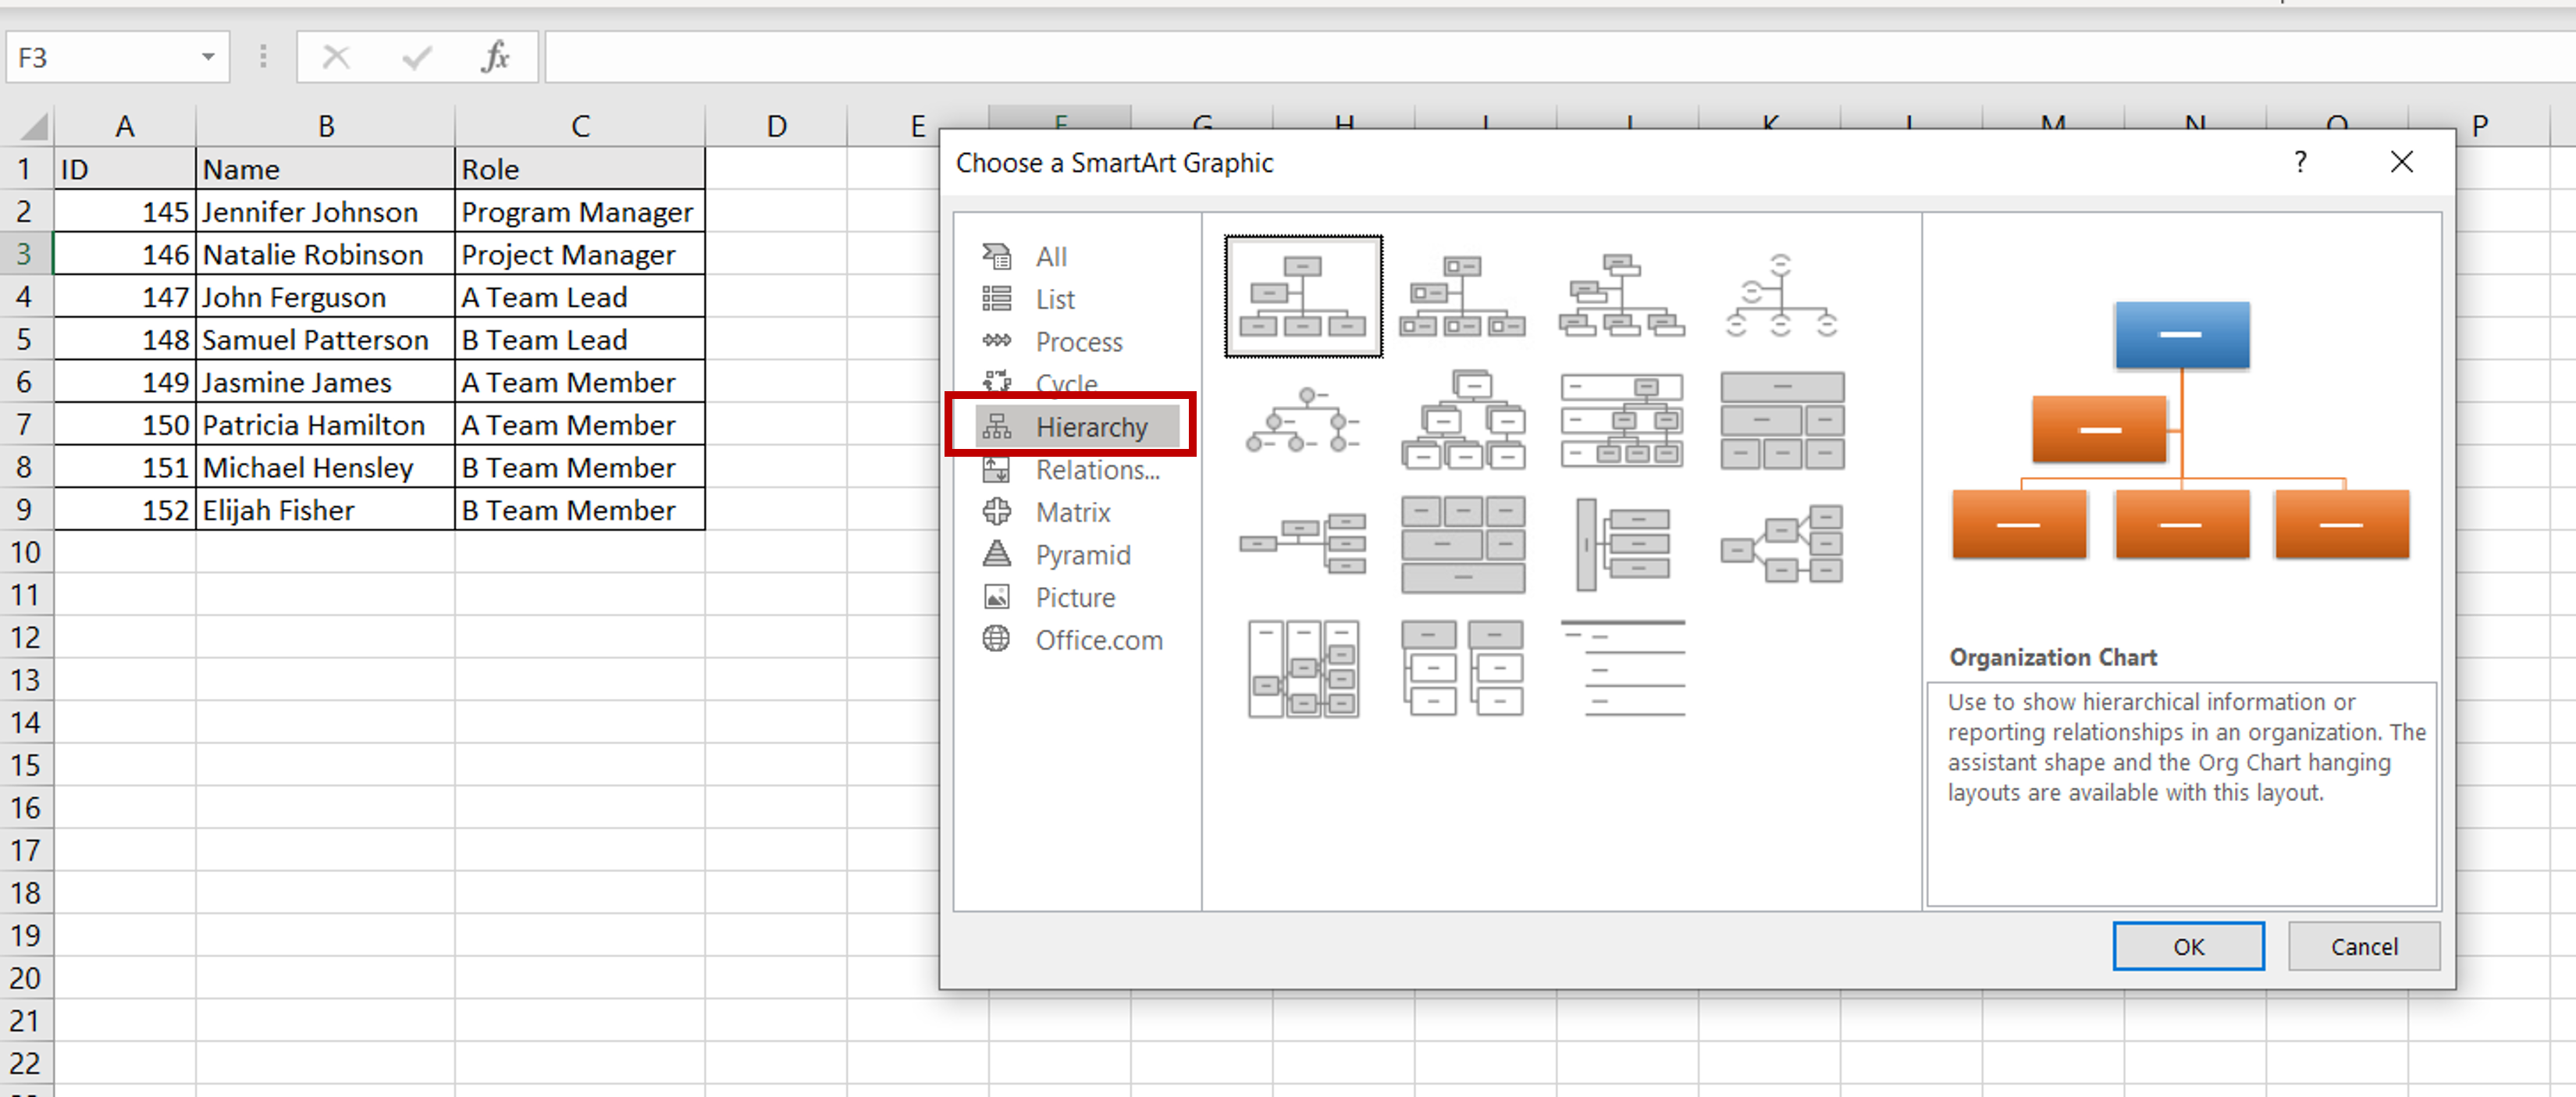
– Go to Hierarchy
– Pick any one of the organizations charts displayed
– Click OK
Step 3 – Open the text pane
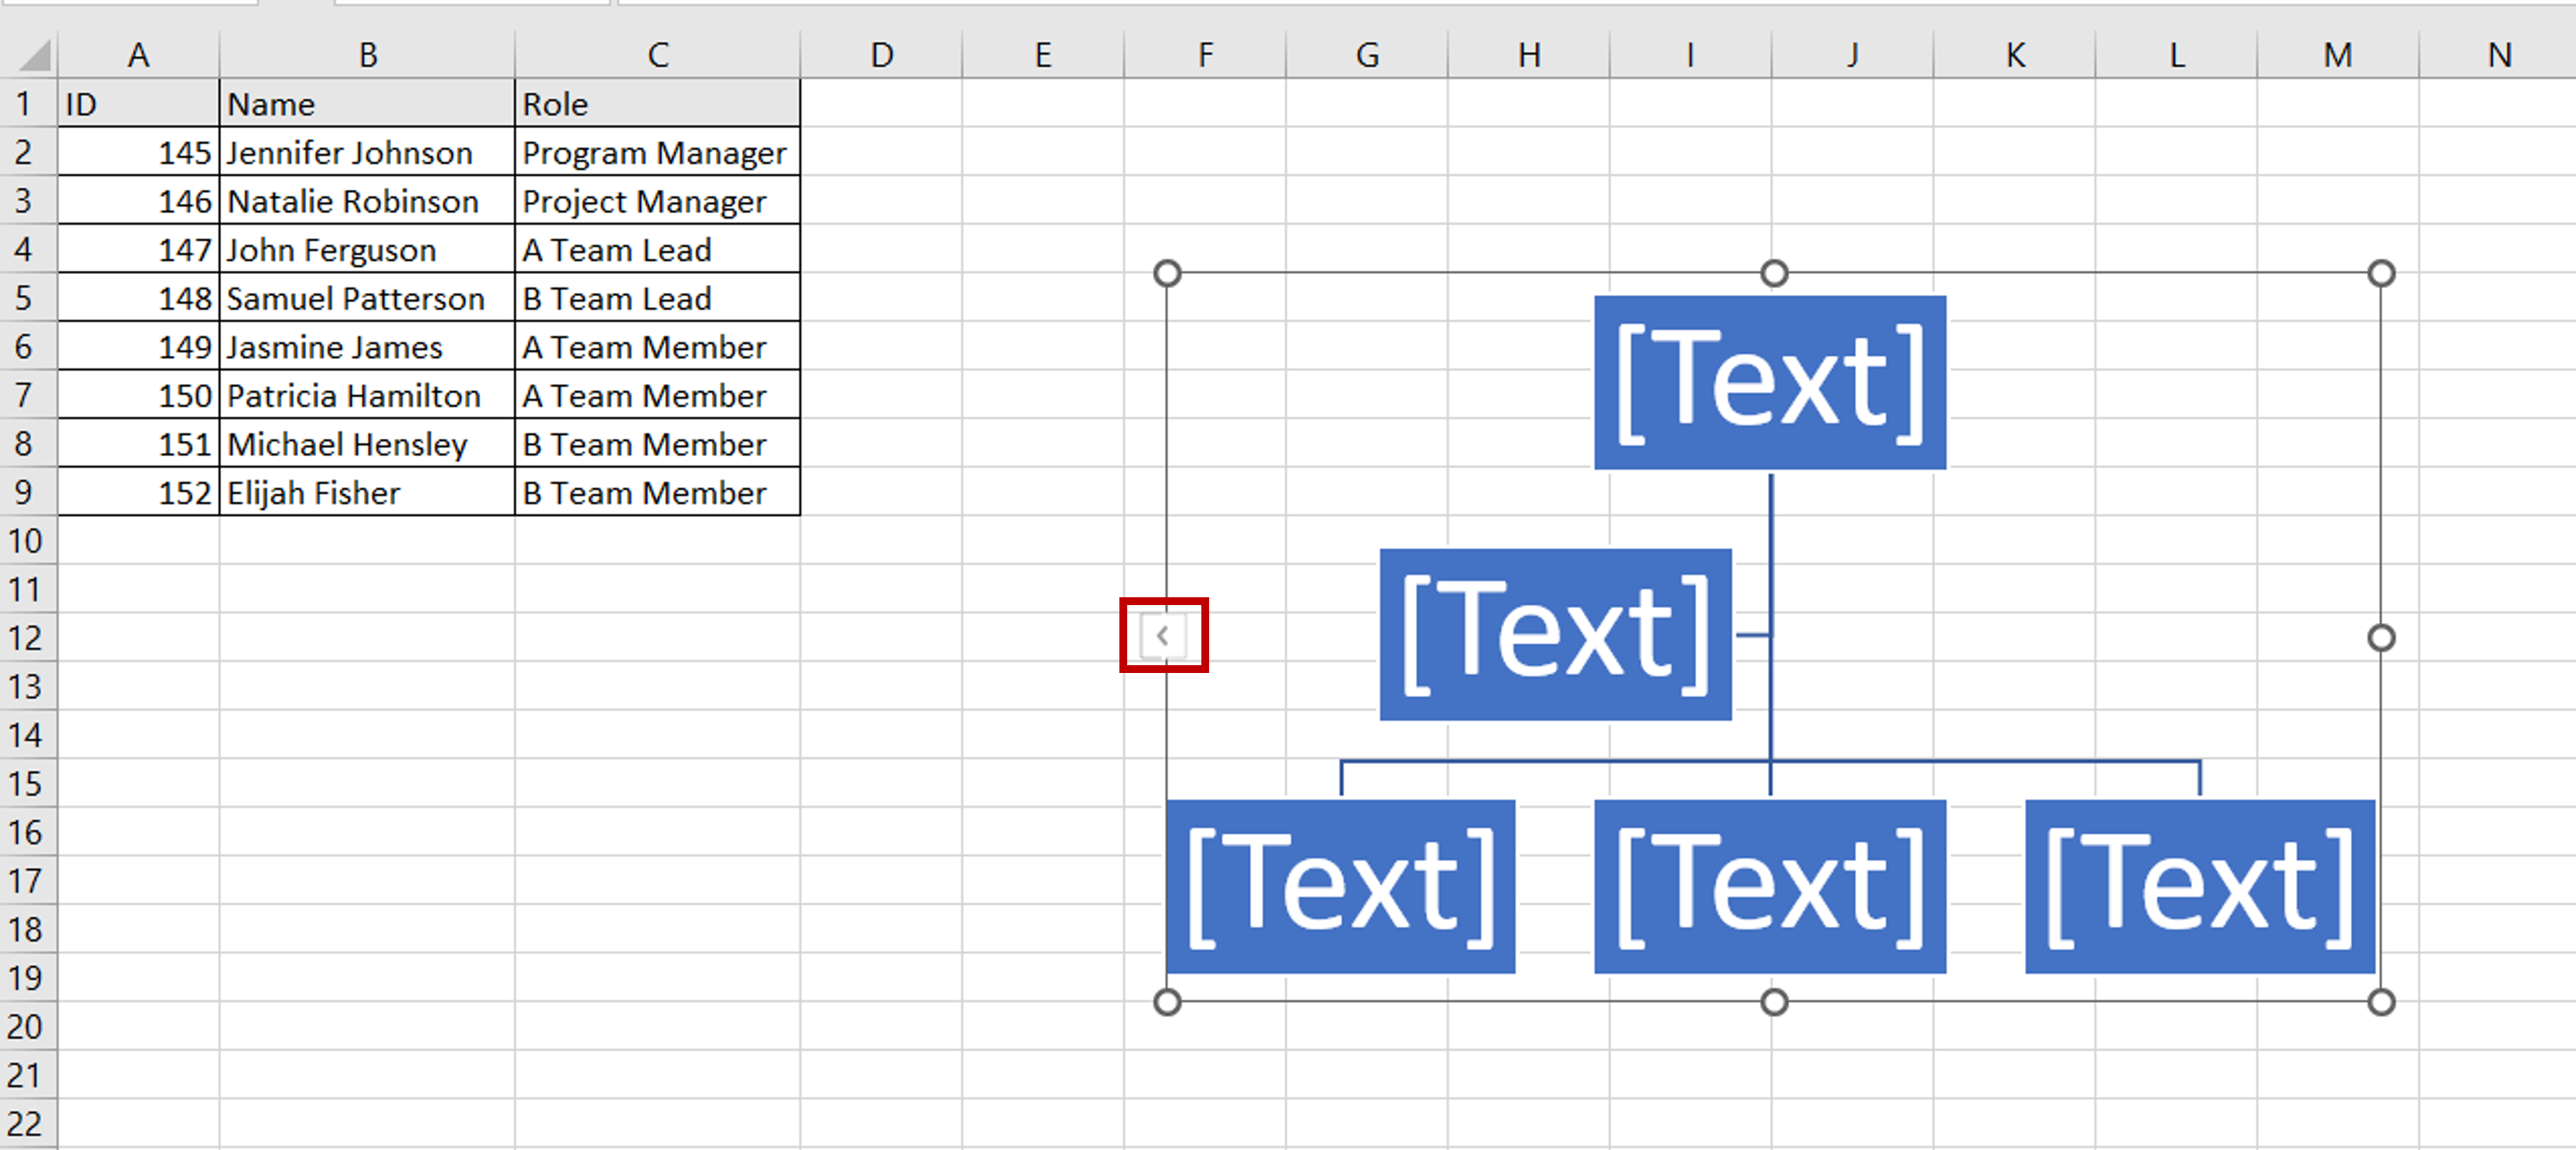
– In the chart that is inserted into the worksheet, click on the arrow on the left border
Step 4 – Create the hierarchy of names
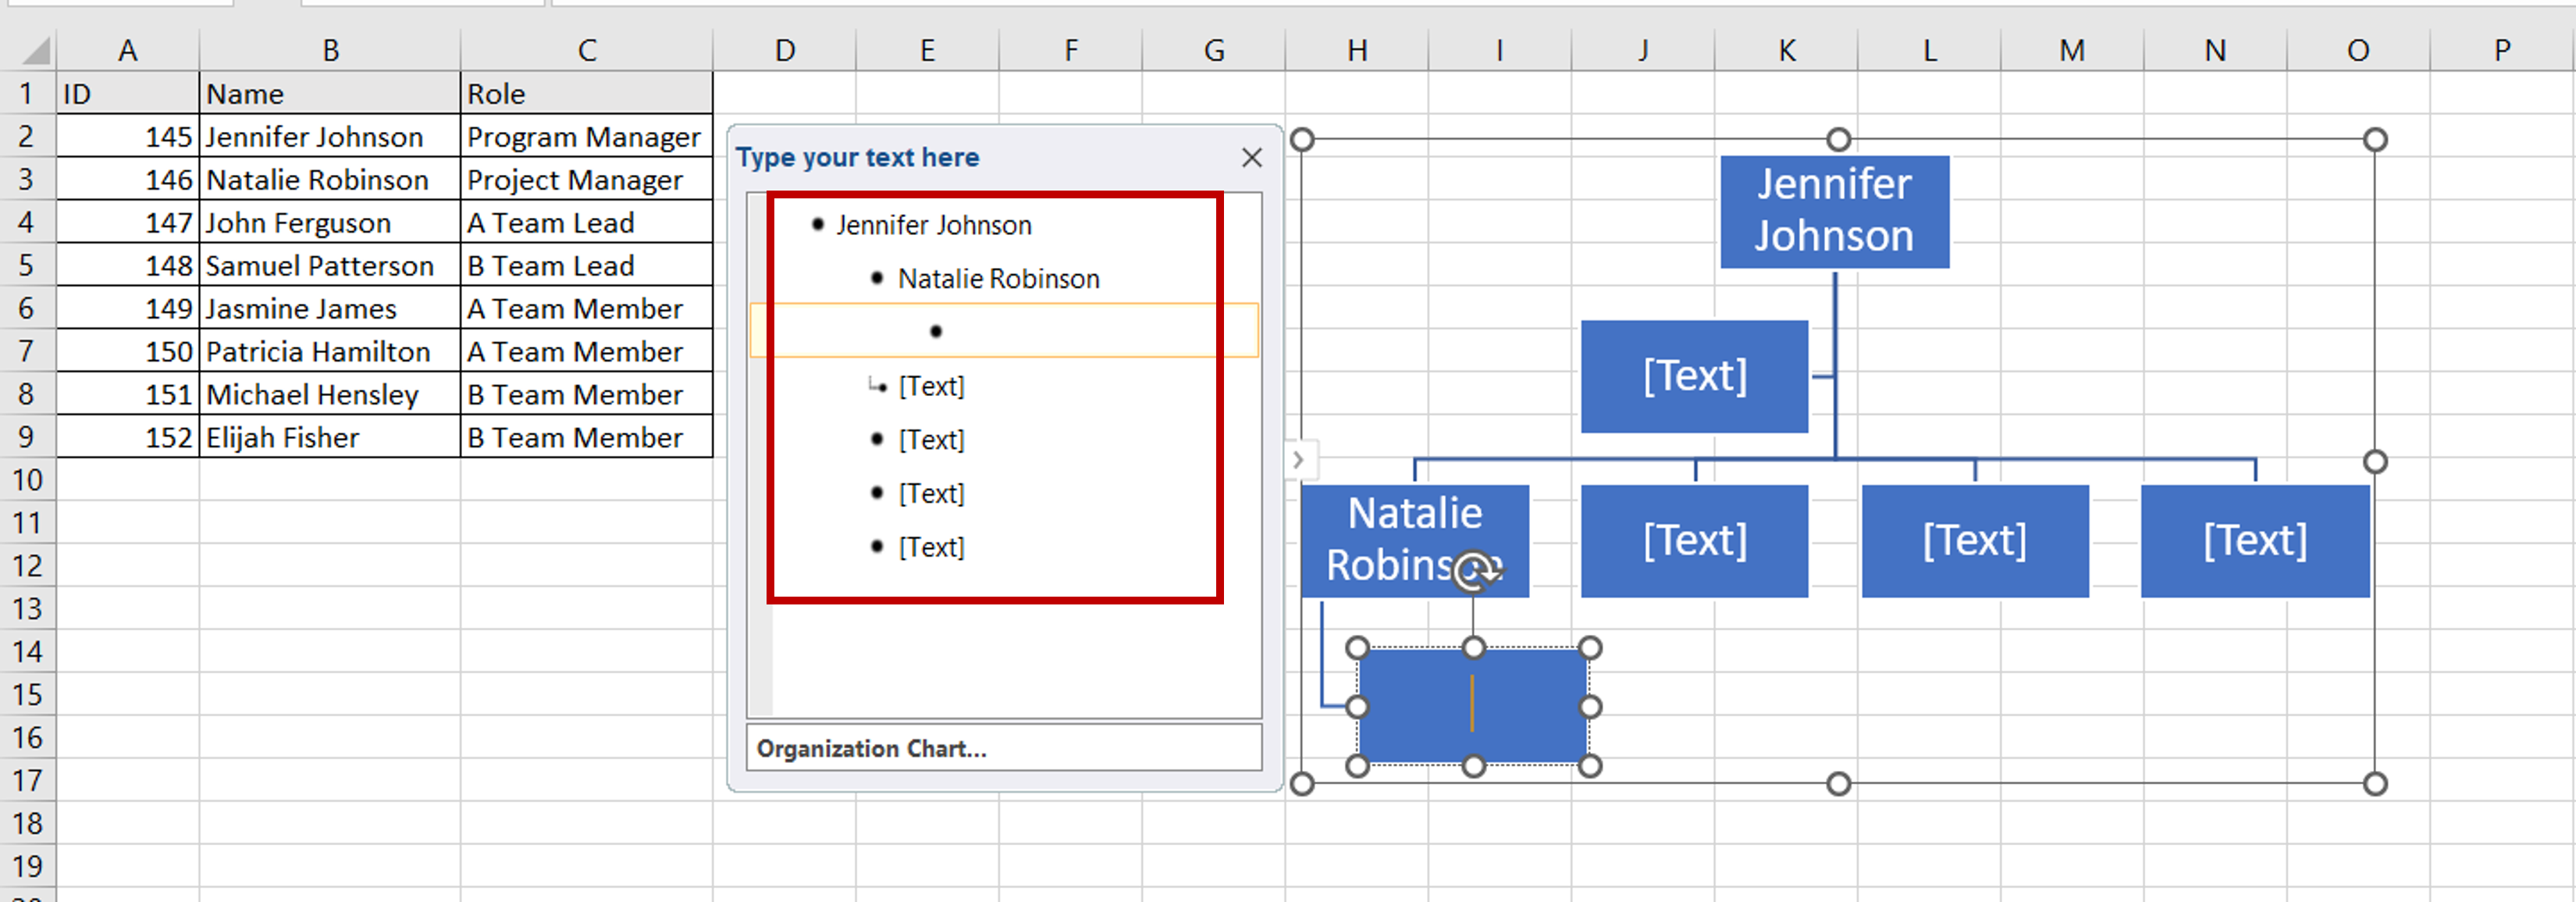
– In the text pane, add the names of people, starting with the topmost person in the hierarchy
– Press TAB to indent to the next level of the hierarchy
– Press ENTER to enter names in the same level of the hierarchy
– To bring a name to the previous level (unindent) press SHIFT+TAB
Step 5 – Check and format the result
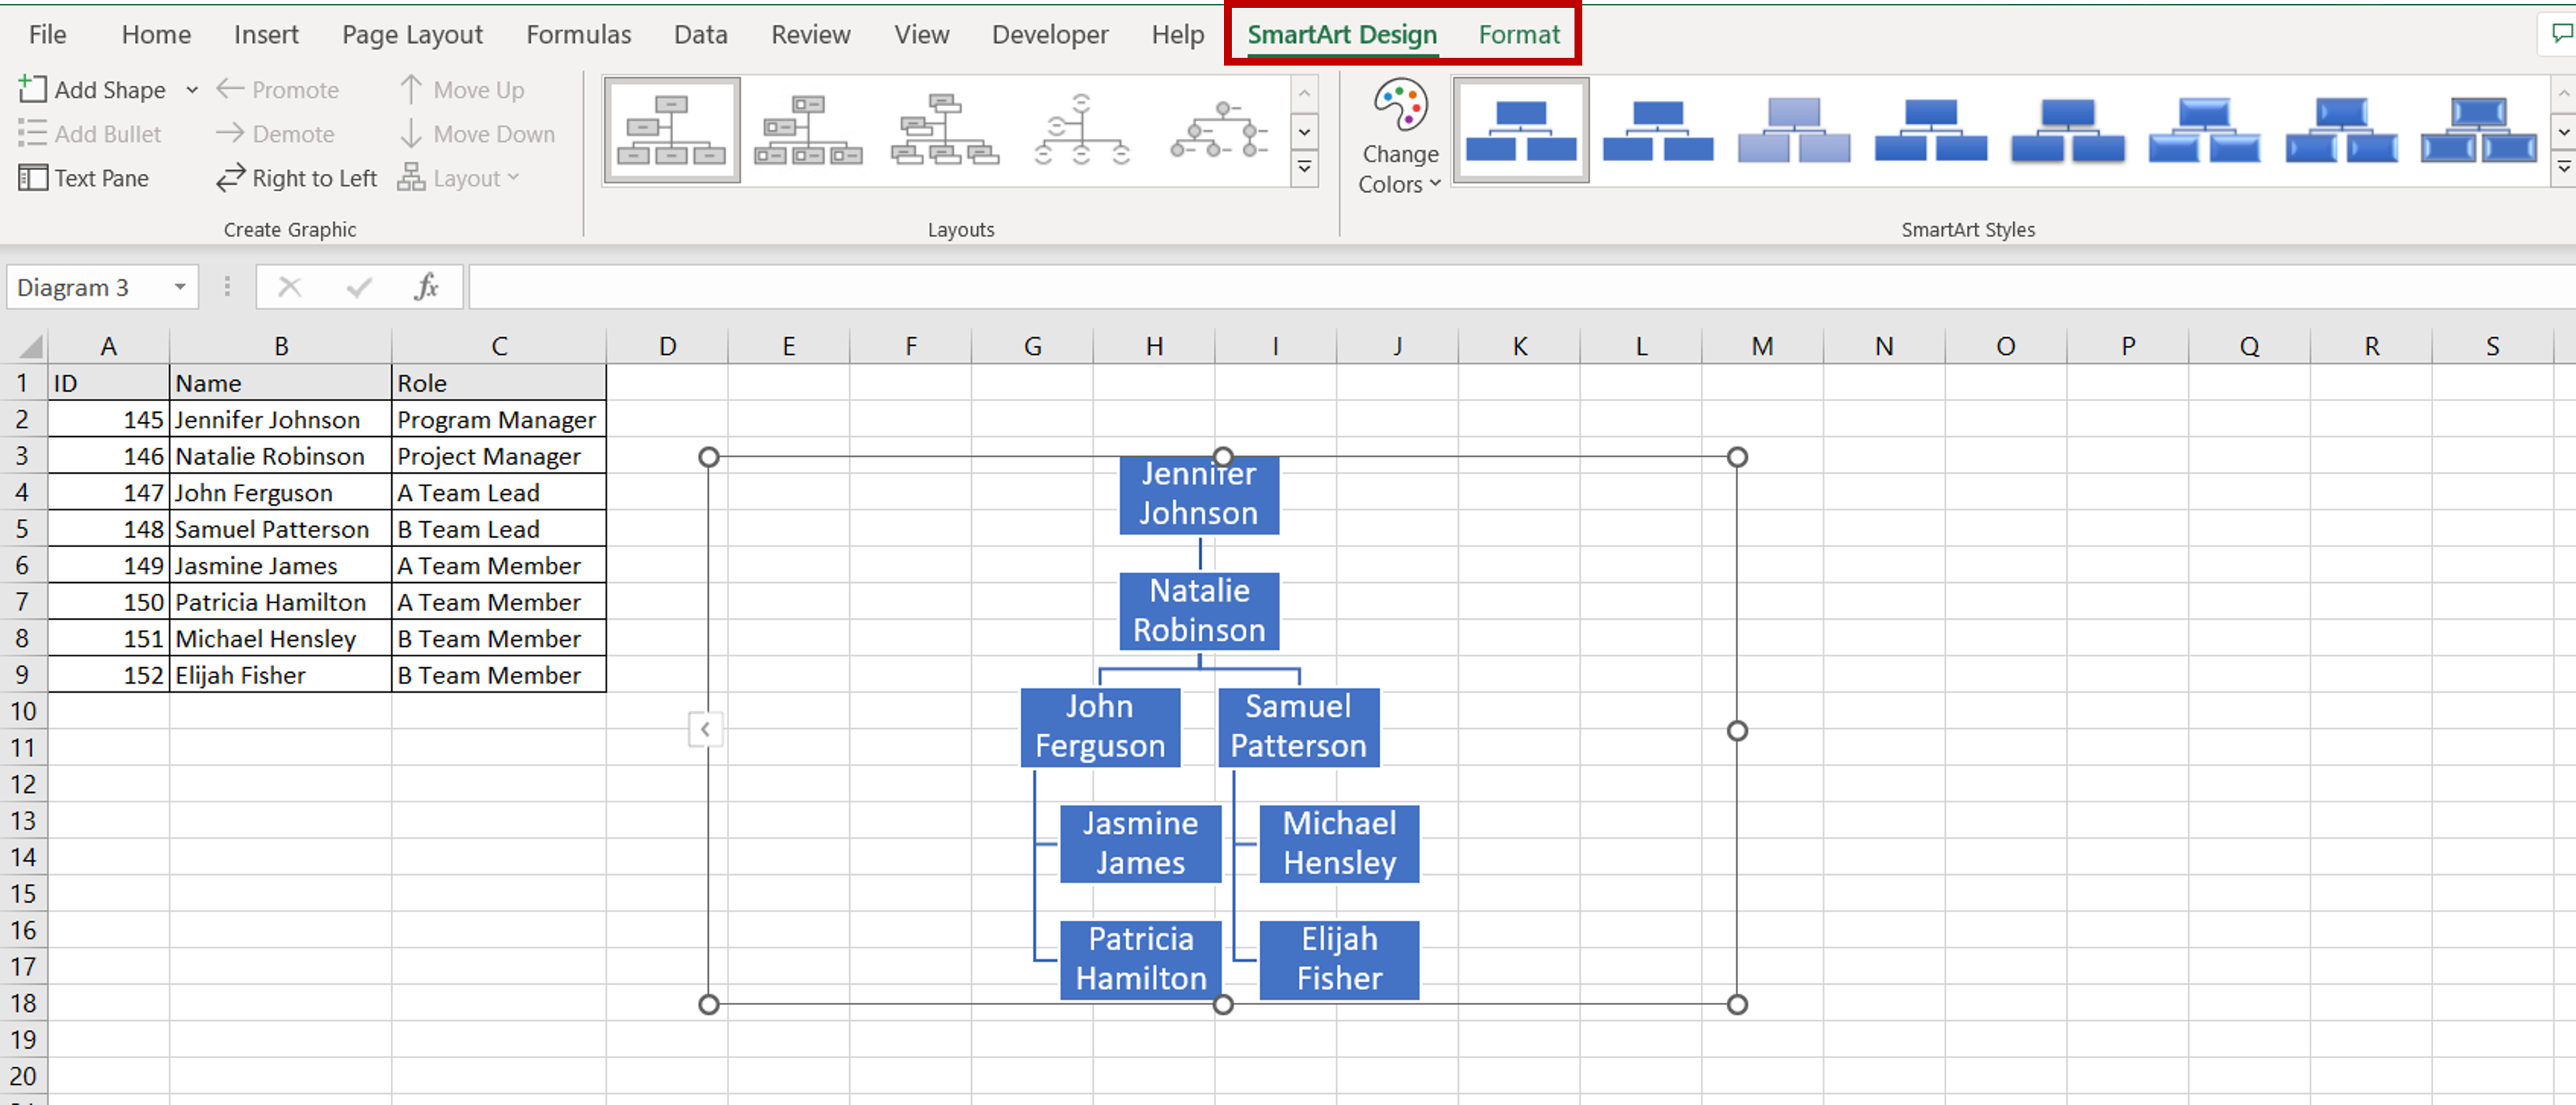
– Format the chart using one of the preset designs under SmartArt Design or customize the chart using the Format options


