How to insert a table into Google Sheets
 By
SpreadCheaters
By
SpreadCheaters
You can watch a video tutorial here.
To insert a table into Google Sheets, it has to be inserted as a type of chart. Data on a sheet can be converted into a table chart that can be sorted and organized into pages. A table chart is inserted as an object on a worksheet and can be manipulated independently without disturbing the data on the worksheet. A good way to use a Table chart is when data organized as a table has to be included in a dashboard.
Step 1 – Select the data
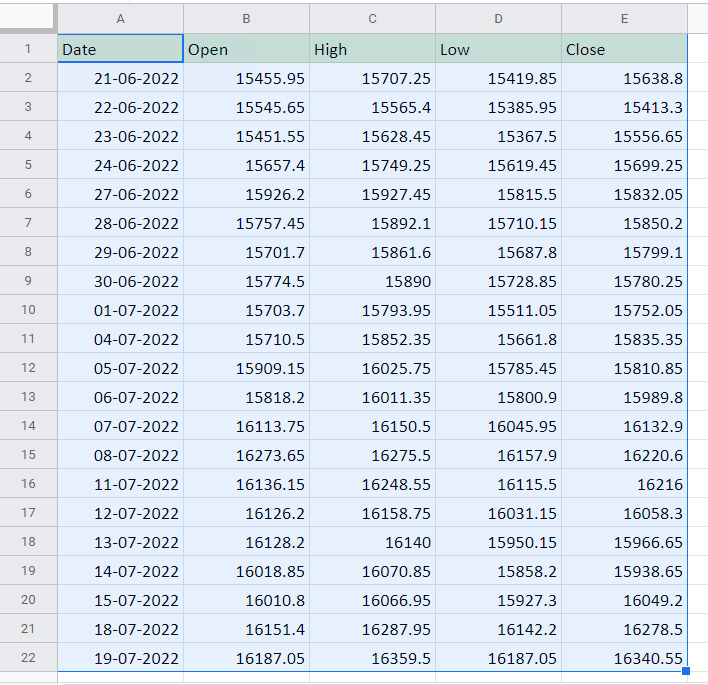
– Select the data to be inserted as a table
Step 2 – Open the Chart Editor
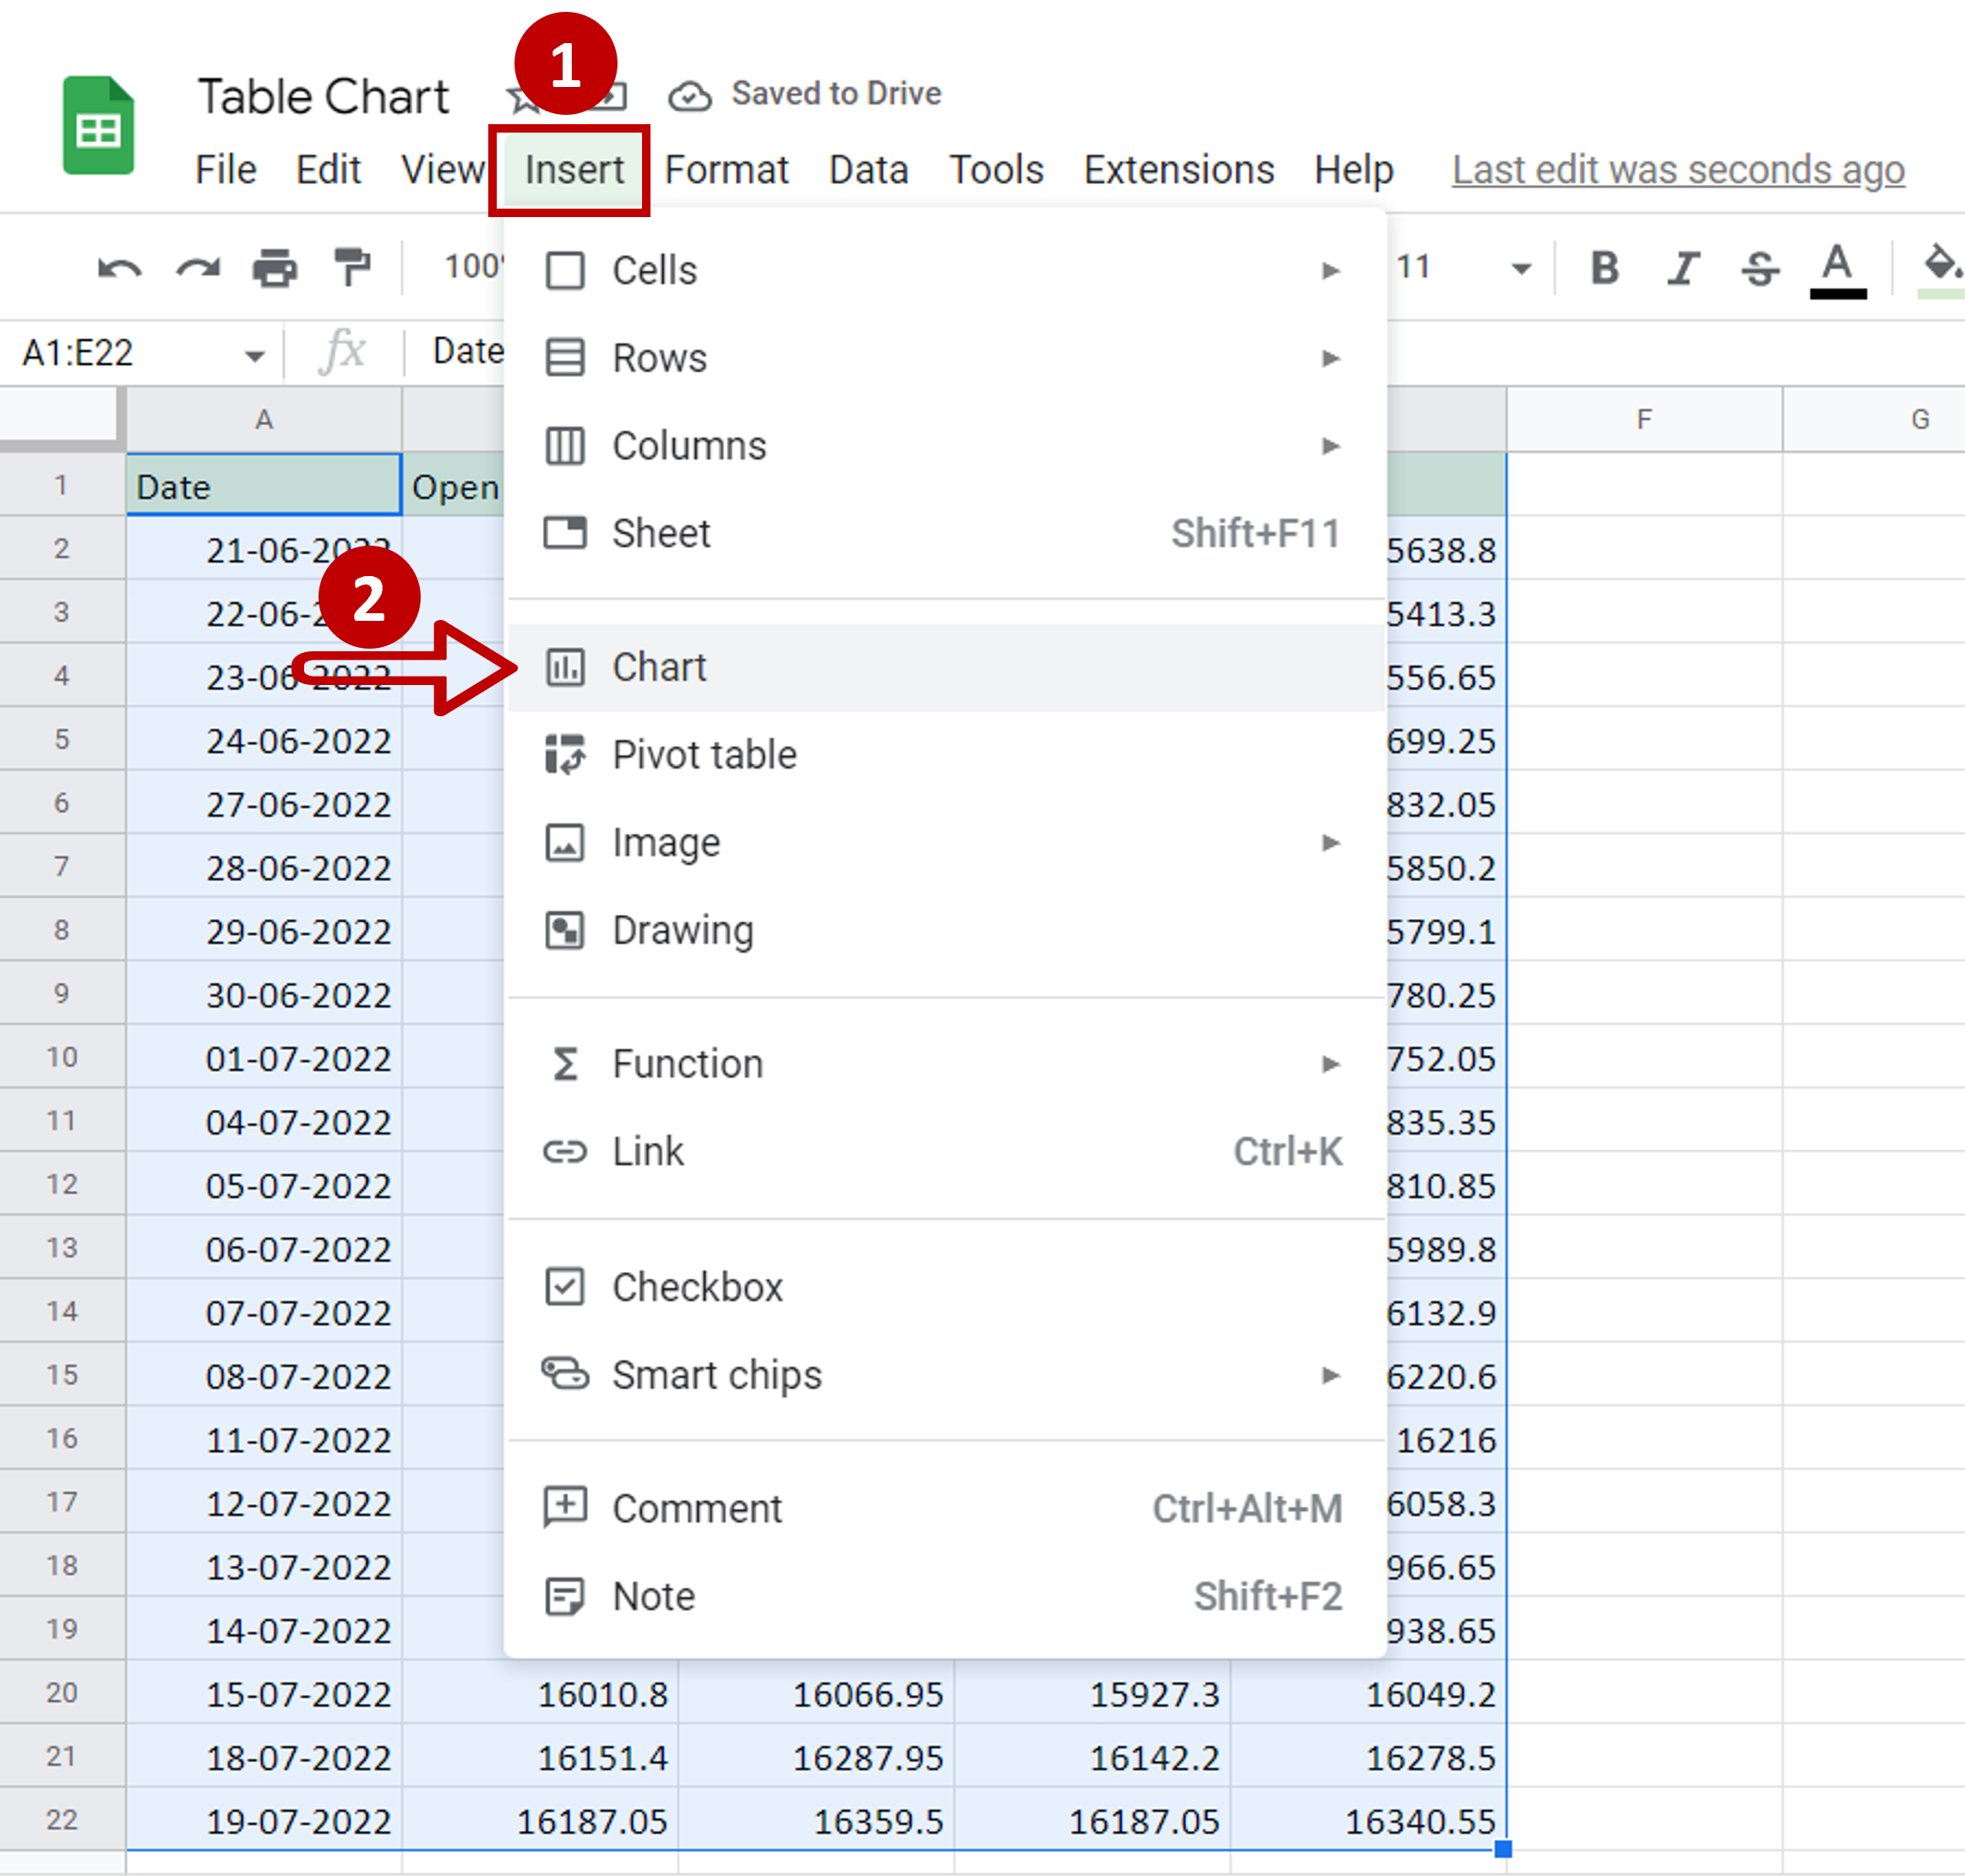
– Go to Insert
– Click on Chart
Step 3 – Change the chart type
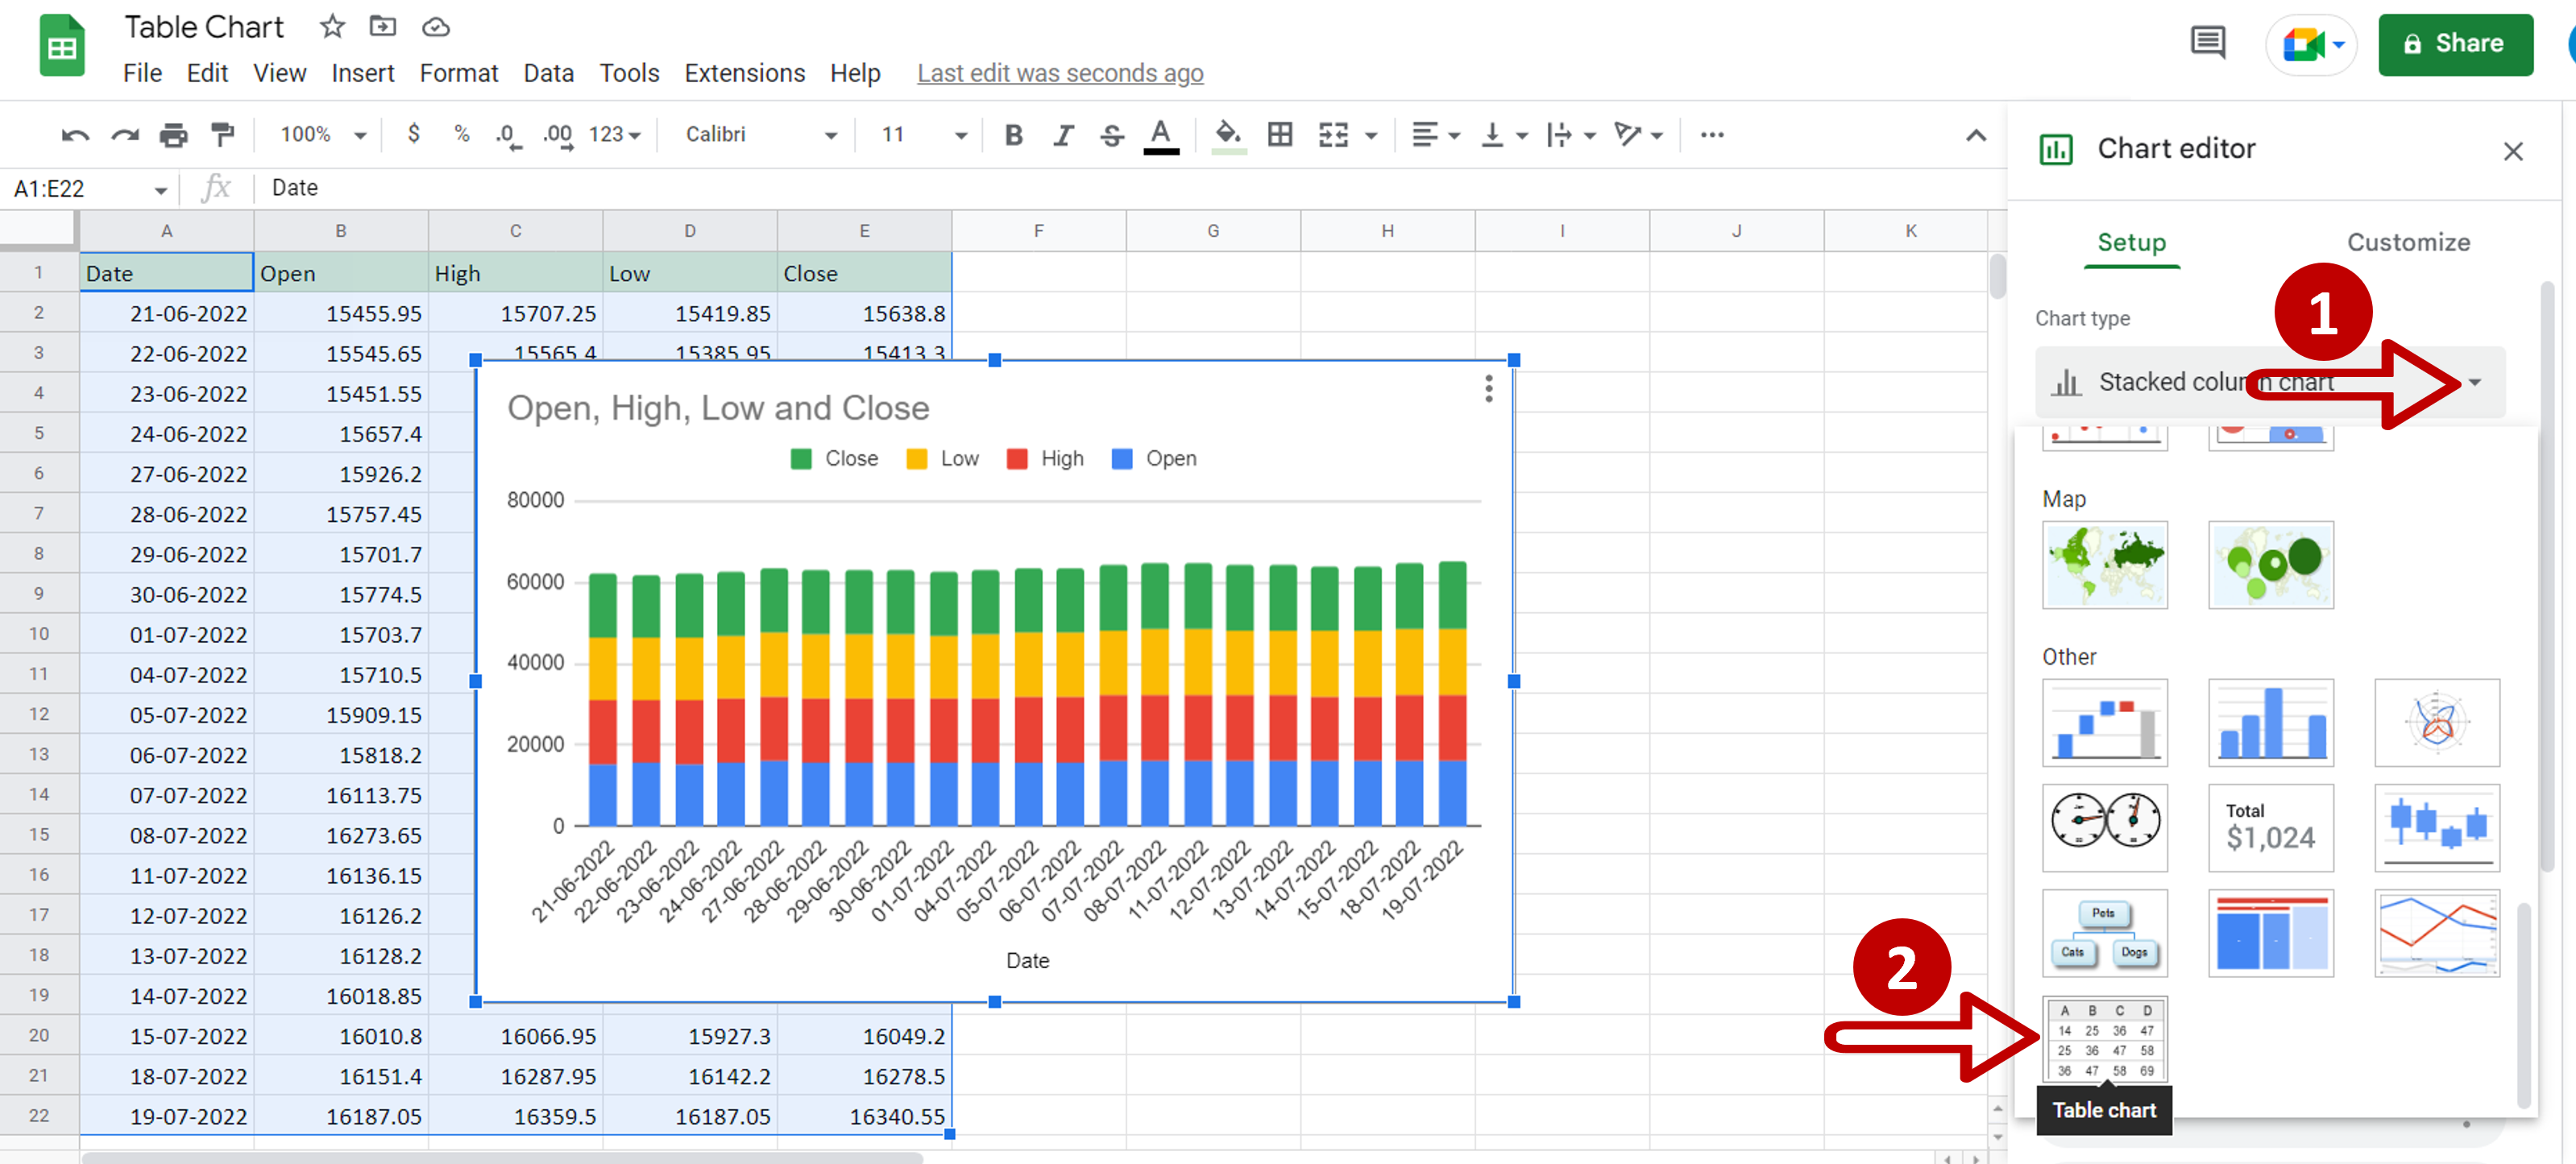
– Expand the Chart type dropdown
– Scroll down and select the Table chart
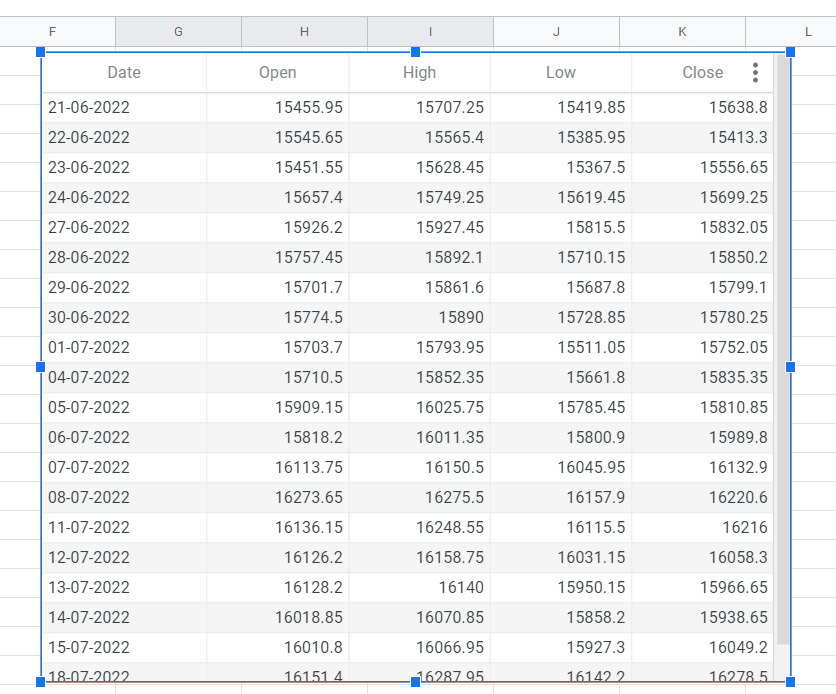
Step 4 – Position and customize the table
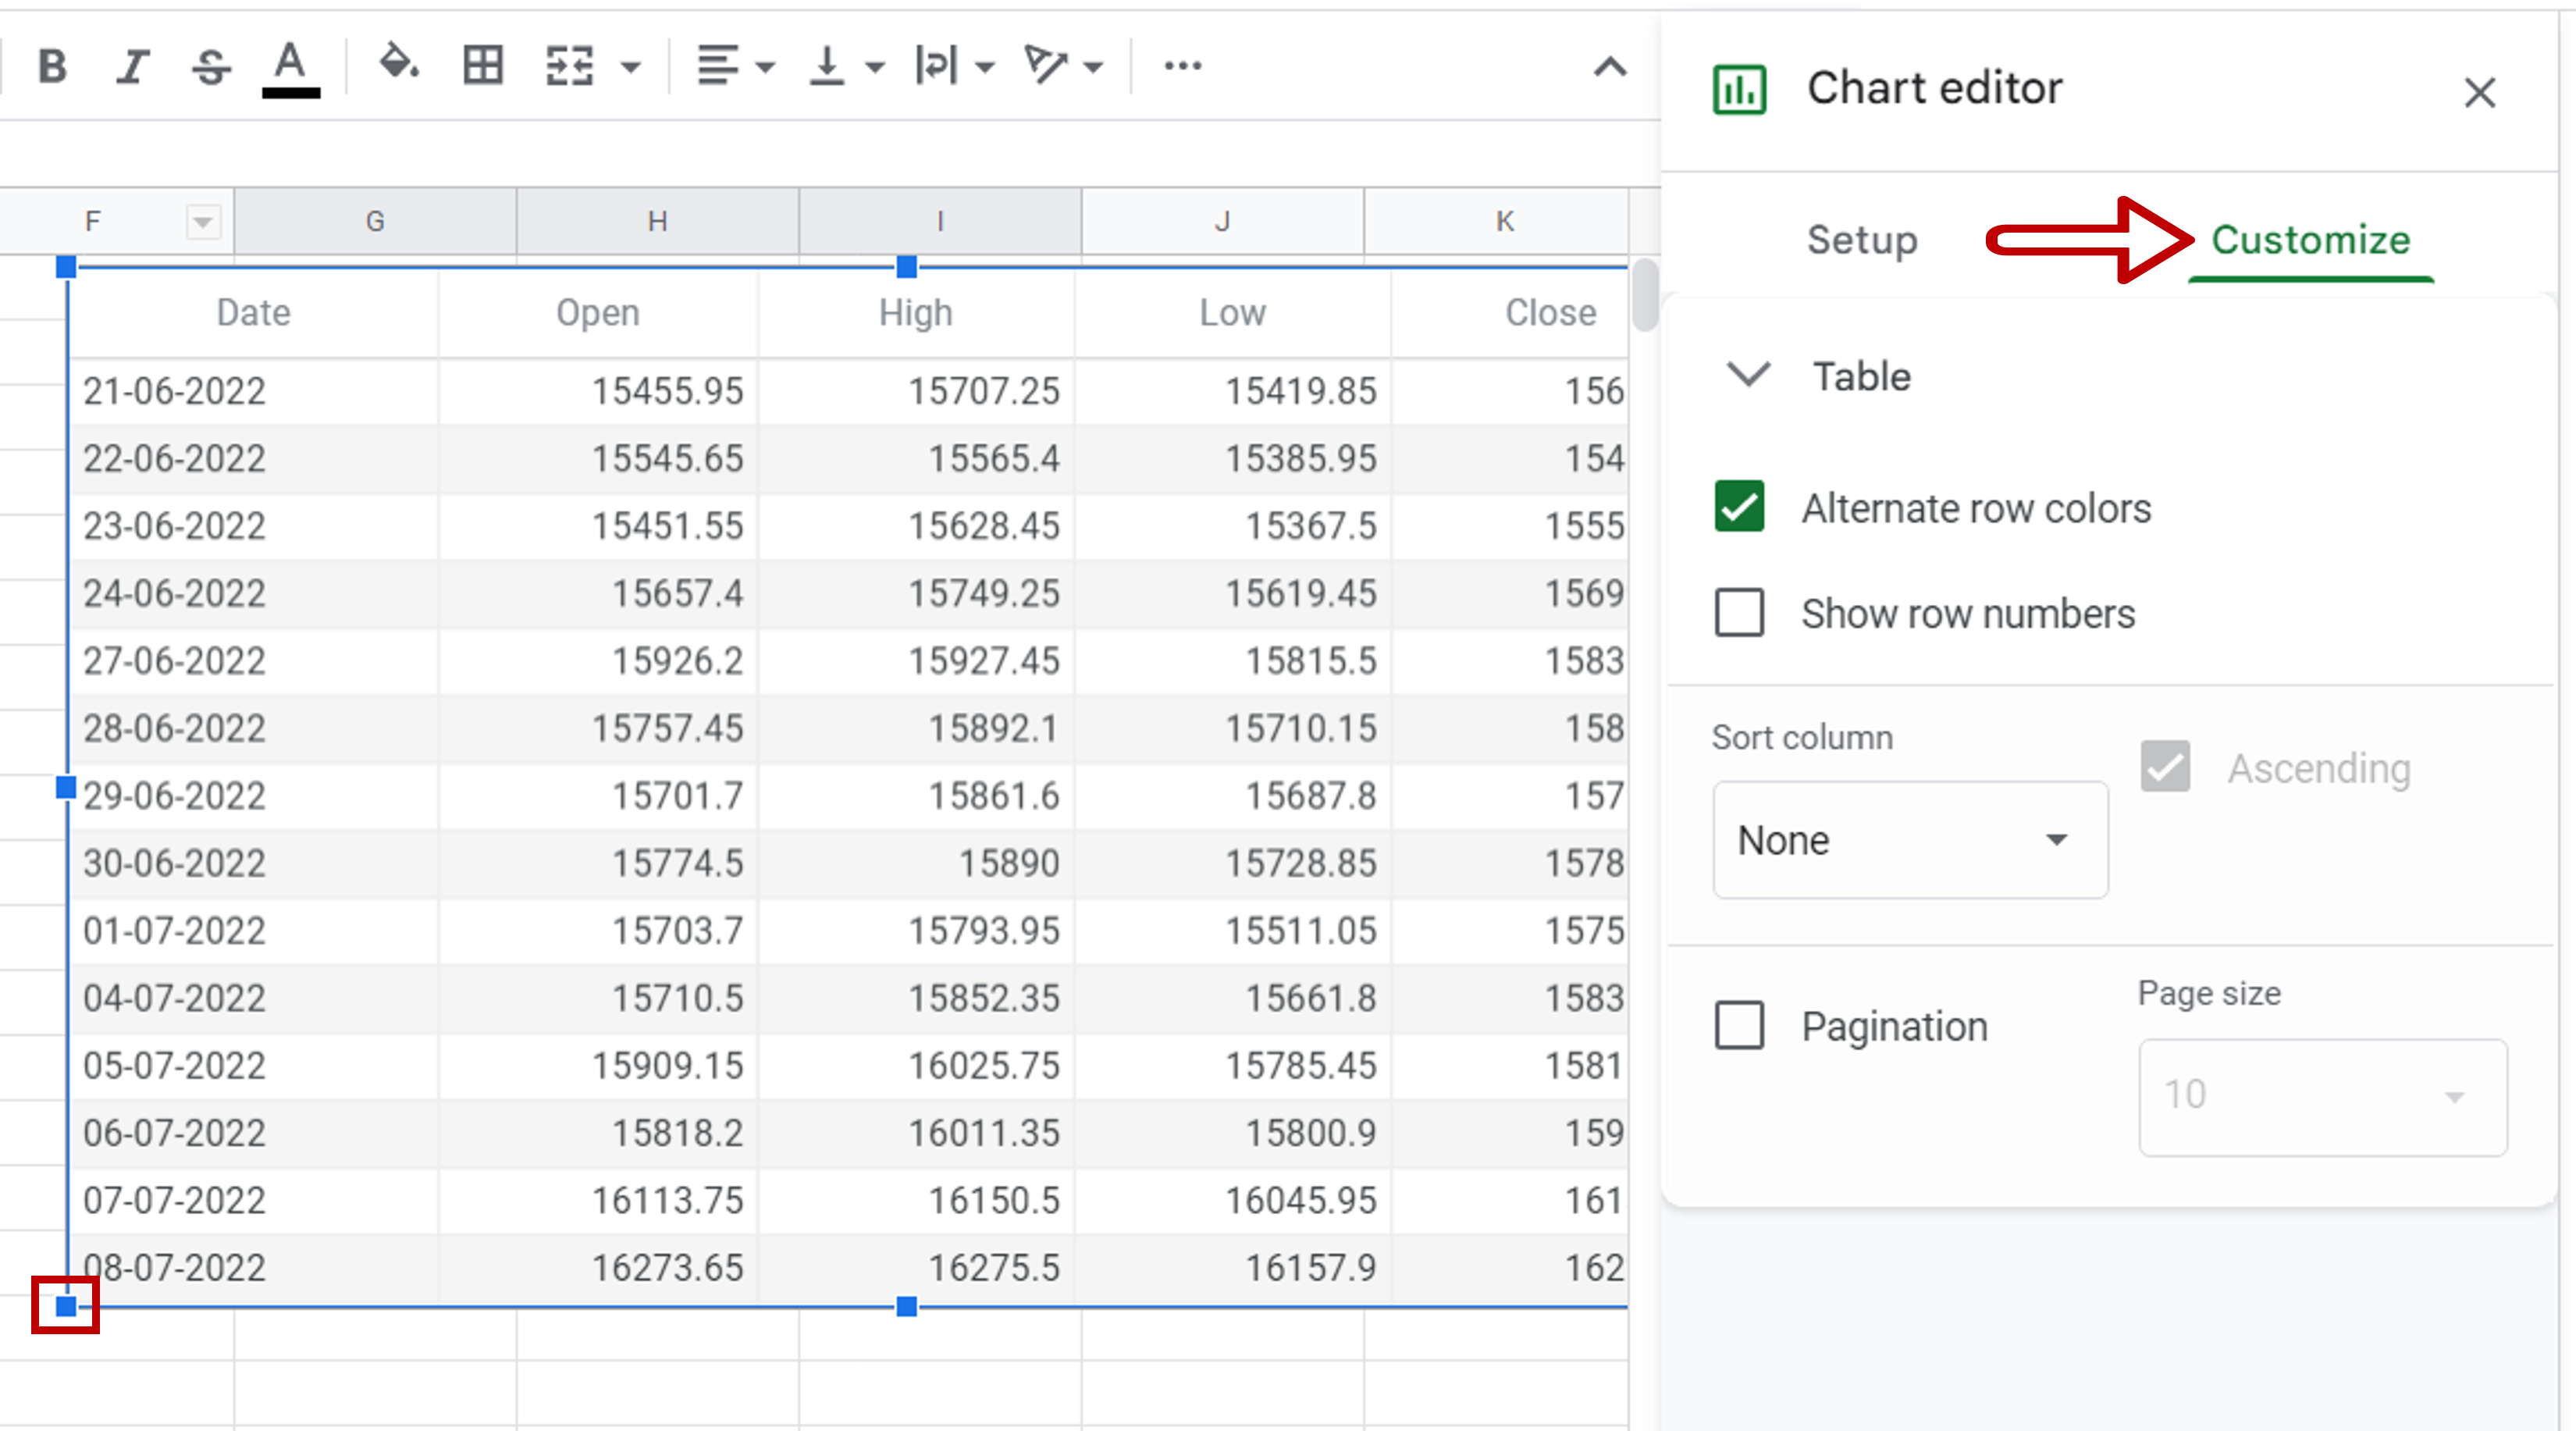
– Drag the Table chart object to position it on the sheet
– Resize the chart using the resize handles on the borders
– Use the Customize option in the Chart Editor to customize the table chart